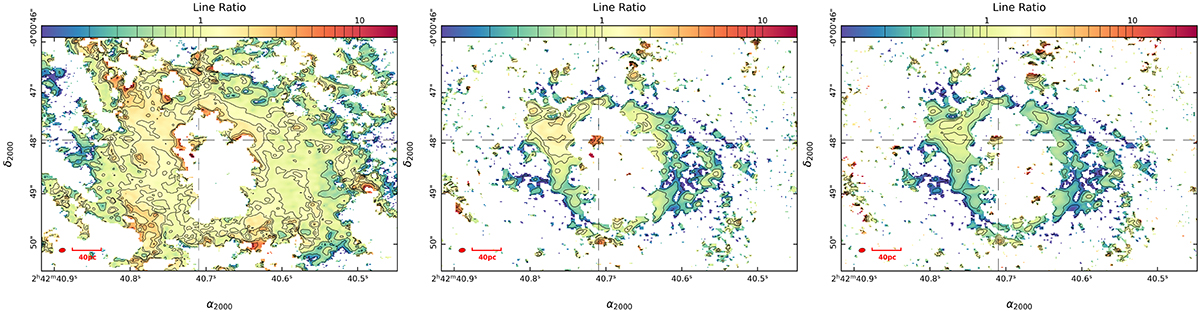
Fig. B.1.
Download original image
CO(3-2)/CO(2-1), CO(6-5)/CO(2-1), and CO(6-5)/CO(3-2) line ratio maps shown in the left, middle, and right panels, respectively. The color ranges from 0.1 to the maximum ratio for each plot. In the left panel, the contours span the same extent as the color bar with levels 0.1σ, 0.2σ, 0.4σ, 0.8σ, 1σ, 1.5σ, 2σ, 4σ, 6σ, 8σ, and 10σ where 1σ = 2.141273, the root-mean-square value from each ratio map. For the middle panel, the contour levels are 0.1σ, 0.2σ, 0.4σ, 0.8σ, 1σ, 1.5σ, 2σ, 3σ, 4σ, and 5σ with 1σ = 4.712347. The right panel contains contours with levels 0.05σ, 0.1σ, 0.2σ, 0.4σ, 0.6σ, 1σ, 1.5σ, 2σ, 3σ, 4σ, and 6σ, where 1σ = 5.144535. The symbols and markers for all panels are the same as in Fig. 1.
Current usage metrics show cumulative count of Article Views (full-text article views including HTML views, PDF and ePub downloads, according to the available data) and Abstracts Views on Vision4Press platform.
Data correspond to usage on the plateform after 2015. The current usage metrics is available 48-96 hours after online publication and is updated daily on week days.
Initial download of the metrics may take a while.