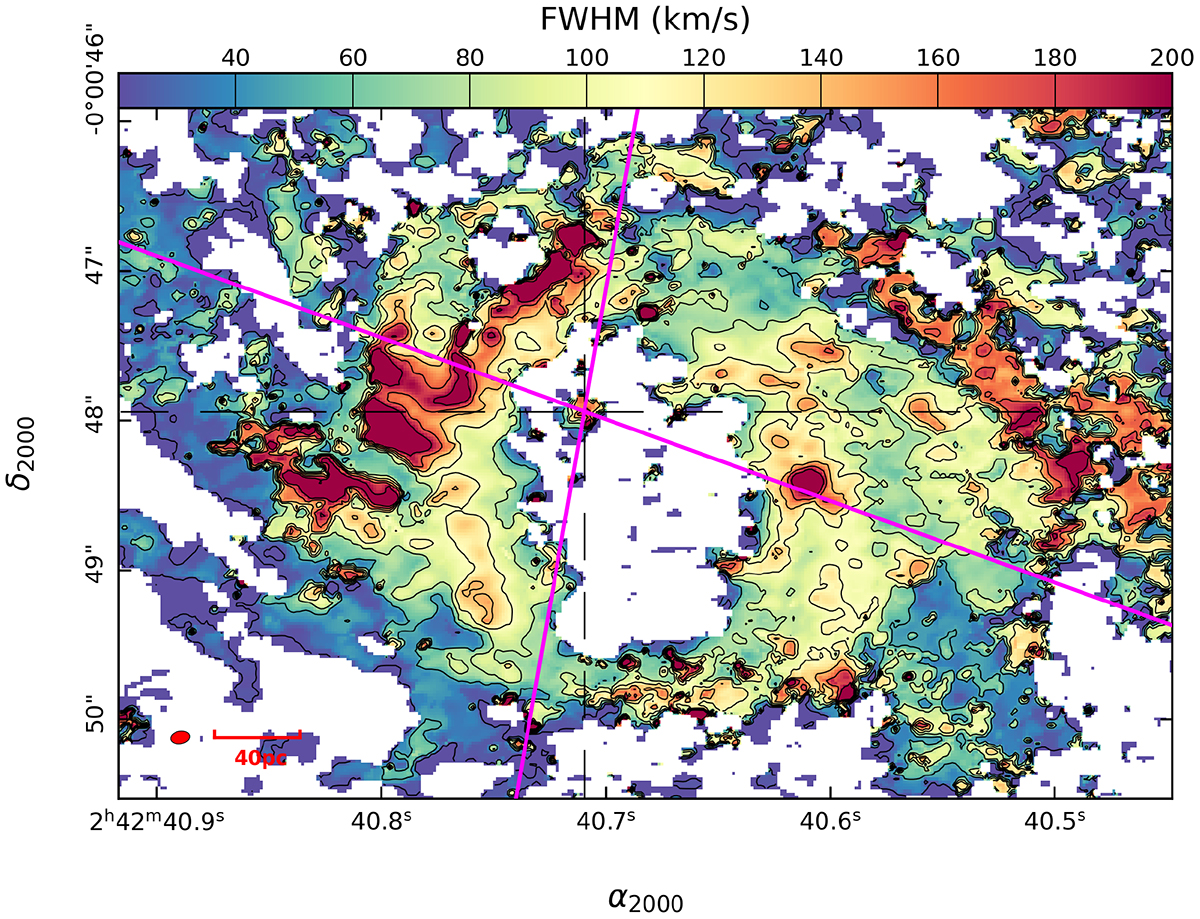
Fig. 2.
Download original image
CO(2–1) velocity-width map of the CND in units of FWHM. The color scale spans the range [20, 200] km s−1, and the contours traverse the same range with a step size of 30 km s−1. The magenta lines trace the borders of the previously constructed AGN wind bicone (Das et al. 2006). The remaining markers and symbols are the same as in Fig. 1.
Current usage metrics show cumulative count of Article Views (full-text article views including HTML views, PDF and ePub downloads, according to the available data) and Abstracts Views on Vision4Press platform.
Data correspond to usage on the plateform after 2015. The current usage metrics is available 48-96 hours after online publication and is updated daily on week days.
Initial download of the metrics may take a while.