Open Access
Fig. 12.
Download original image
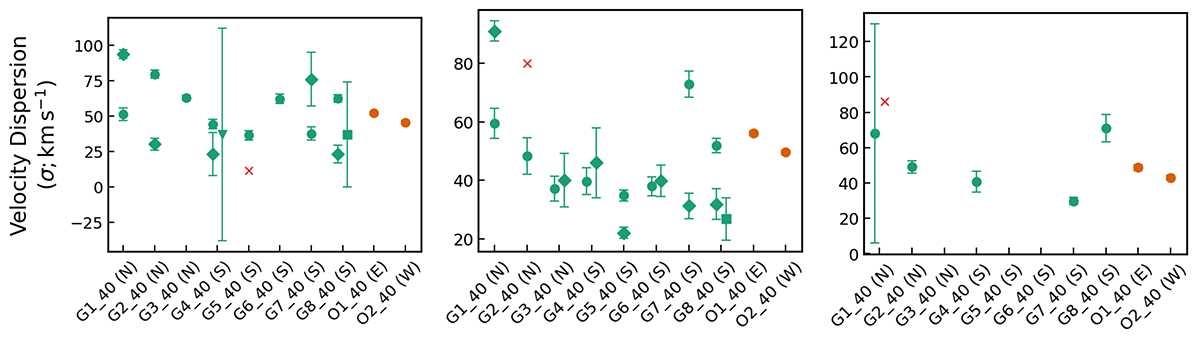
Velocity dispersion values of all Gaussian components fit to the line profiles for the CO(2–1) (left panel), the CO(3–2) (mid panel), and the CO(6–5) (right panel) transitions on the scale of 40×40 pc. All schematics follow that of Fig. 11.
Current usage metrics show cumulative count of Article Views (full-text article views including HTML views, PDF and ePub downloads, according to the available data) and Abstracts Views on Vision4Press platform.
Data correspond to usage on the plateform after 2015. The current usage metrics is available 48-96 hours after online publication and is updated daily on week days.
Initial download of the metrics may take a while.