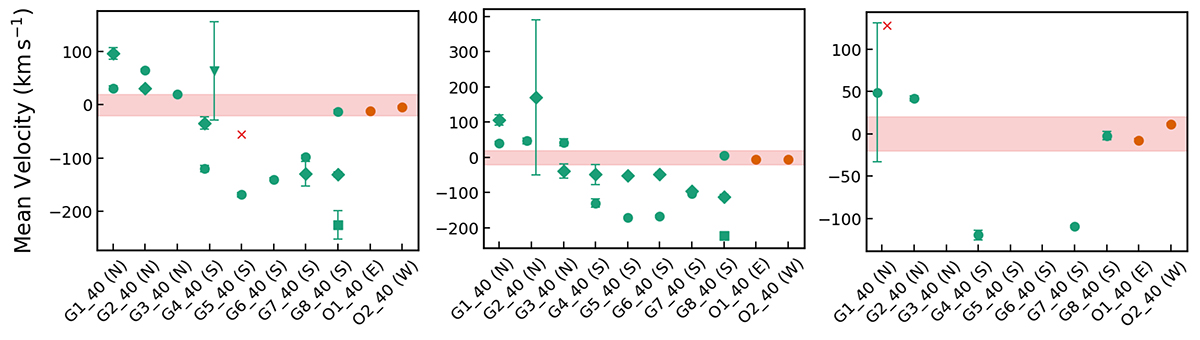
Fig. 11.
Download original image
Mean velocity values of all Gaussian components fit to the line profiles for the CO(2–1) (left panel), the CO(3–2) (mid panel), and the CO(6–5) (right panel) transitions on the scale of 40×40 pc. For each panel, the red shaded region marks ± one channel width away from the systematic velocity of the galaxy, vsys. Based on the weight parameter, round symbols correspond to the largest component of each fit, the diamond symbols correspond to the secondary component of each fit, and the square symbols correspond to the smallest component of each fit. The downward triangle symbol indicates the Gaussian component for absorption, and the “×” symbol implies large error bars. All other schematics are the same as Fig. 6.
Current usage metrics show cumulative count of Article Views (full-text article views including HTML views, PDF and ePub downloads, according to the available data) and Abstracts Views on Vision4Press platform.
Data correspond to usage on the plateform after 2015. The current usage metrics is available 48-96 hours after online publication and is updated daily on week days.
Initial download of the metrics may take a while.