Fig. 1.
Download original image
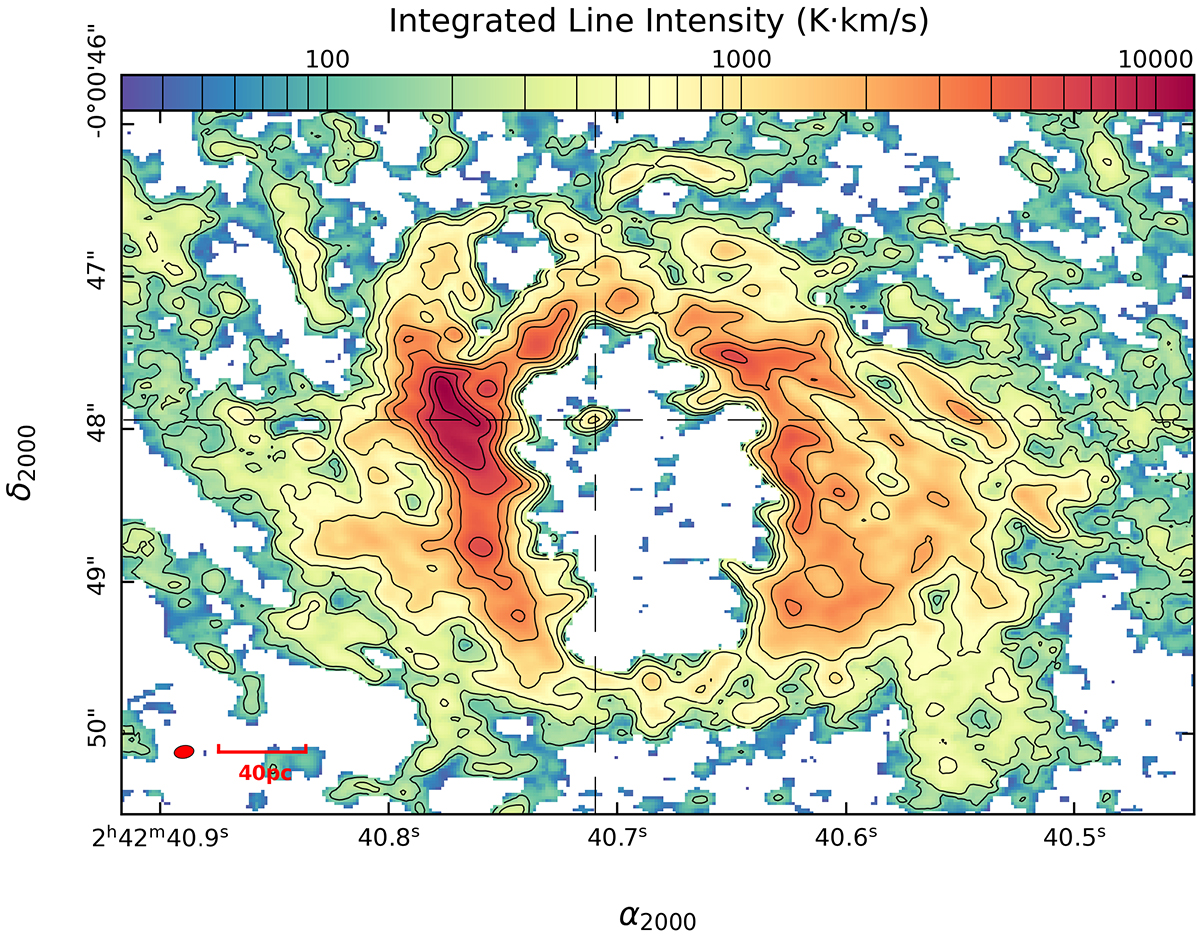
CO(2–1) velocity-integrated map in units of Kelvin kilometers per second (K km s−1) obtained with ALMA in the CND of NGC 1068. The color ranges from the minimum to the maximum value in the logarithmic scale, and the contour covers the same extent with levels 3σ, 5σ, 10σ, 20σ, 40σ, 60σ, 100σ–250σ in steps of 50σ, where 1σ = 50.6 K km s−1. Here, the 1σ value differs slightly from García-Burillo et al. (2019). We integrated over all channels instead of restricting to a certain range around vsys, which does not affect the velocity-integrated maps (this also applies to the CO(3–2) and CO(6–5) transitions, in comparison to García-Burillo et al. 2016). The smallest common beam size is indicated at the lower left corner of the figure, along with a linear scale indicator of 40 pc. The AGN position is also specified with two dashed lines.
Current usage metrics show cumulative count of Article Views (full-text article views including HTML views, PDF and ePub downloads, according to the available data) and Abstracts Views on Vision4Press platform.
Data correspond to usage on the plateform after 2015. The current usage metrics is available 48-96 hours after online publication and is updated daily on week days.
Initial download of the metrics may take a while.