Fig. 6
Download original image
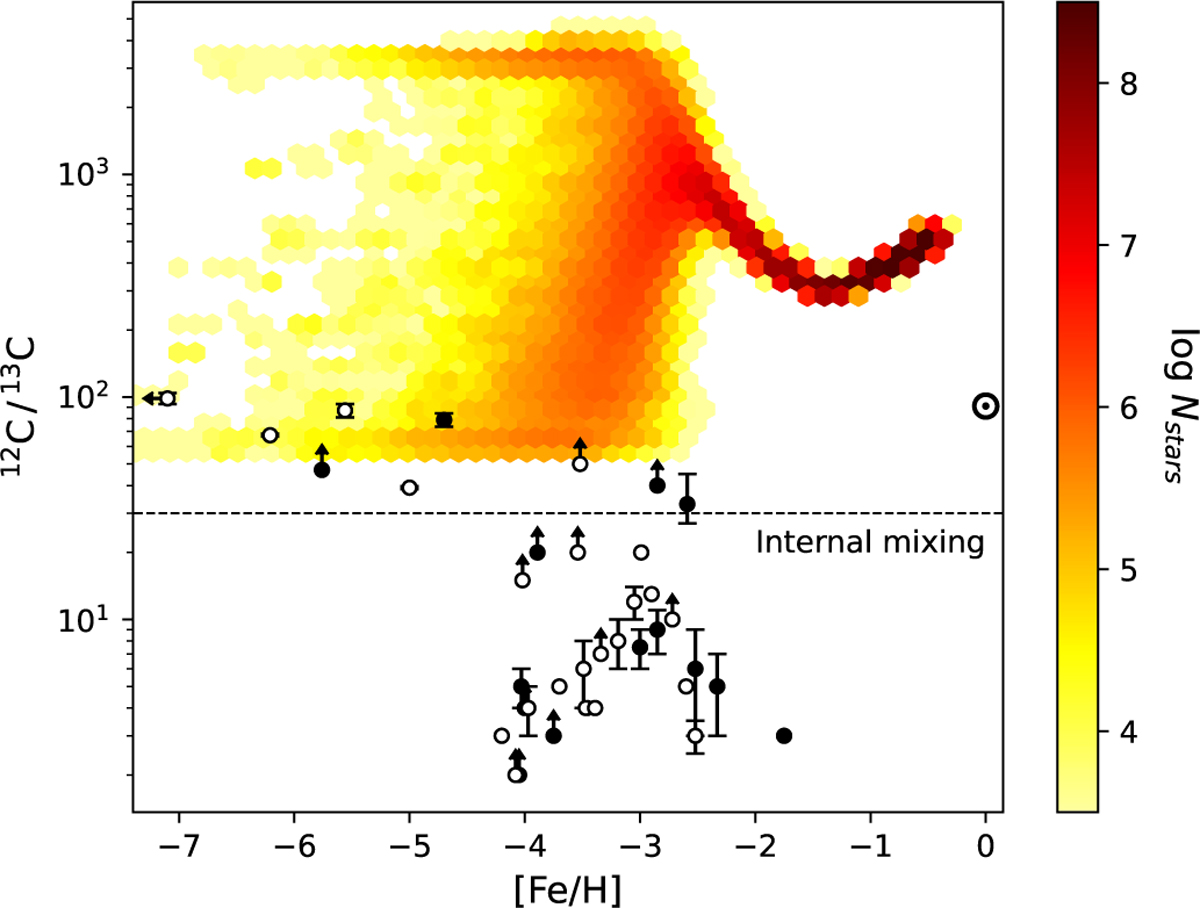
Isotopic ratio 12C/13C versus [Fe/H]. The stochastic model is the colour map, with the number of simulated stars on a logarithmic scale. The dots are the observed halo stars (dwarfs in black, giants in white) as presented in Molaro et al. (2023), complete of their possible error. The horizontal line 12C/13C = 30 marks the evidence for internal mixing in giant stars (Spite et al. 2006).
Current usage metrics show cumulative count of Article Views (full-text article views including HTML views, PDF and ePub downloads, according to the available data) and Abstracts Views on Vision4Press platform.
Data correspond to usage on the plateform after 2015. The current usage metrics is available 48-96 hours after online publication and is updated daily on week days.
Initial download of the metrics may take a while.