Open Access
Fig. 11
Download original image
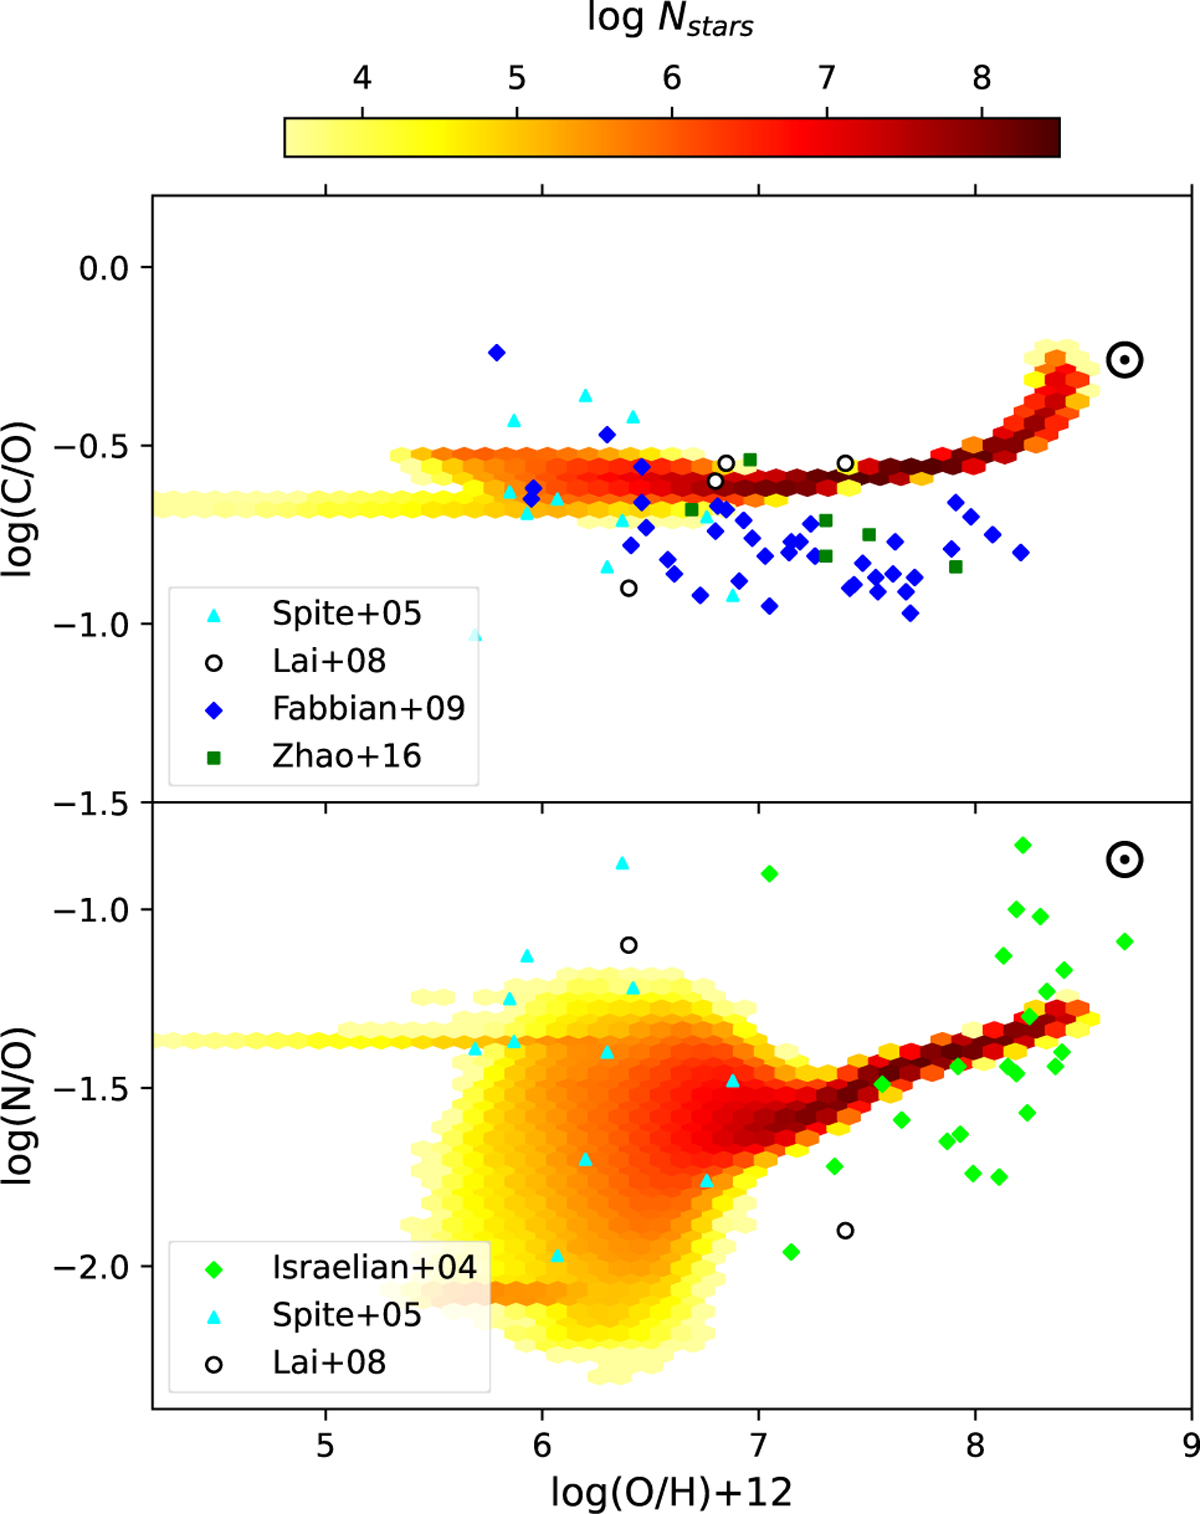
log(C/O) and log(N/O) versus log(O/H)+12. The stochastic model is the colour map, with the number of simulated stars in log scale. The dots are the observed dwarf or unmixed giant halo stars as presented in Section 2. The symbol of the Sun refers to solar values (Asplund et al. 2009).
Current usage metrics show cumulative count of Article Views (full-text article views including HTML views, PDF and ePub downloads, according to the available data) and Abstracts Views on Vision4Press platform.
Data correspond to usage on the plateform after 2015. The current usage metrics is available 48-96 hours after online publication and is updated daily on week days.
Initial download of the metrics may take a while.