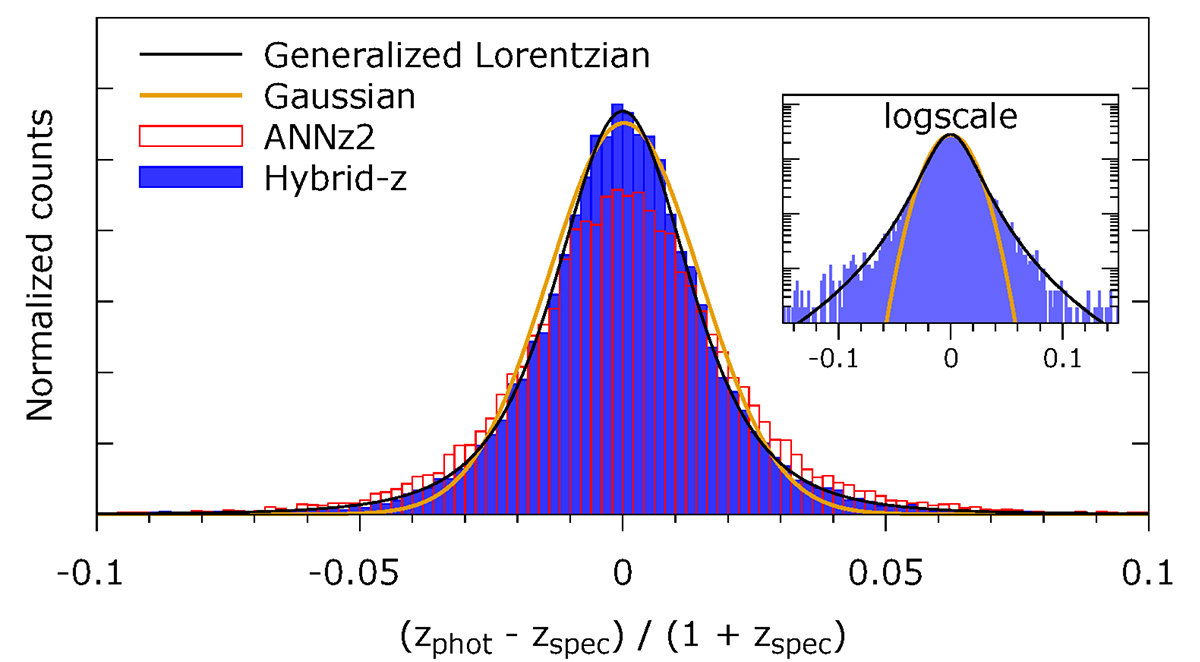
Fig. 6.
Download original image
Comparison of photometric redshift error distributions between Hybrid-z (blue, this work) and ANNz2 (B21, red) shown as normalized counts based on the test sample results. Solid lines illustrate the best-fit Gaussian (with σ = 0.0145 and μ = 2.56 × 10⁻⁴, yellow) and generalized Lorentzian (Eq. 10, with a = 2.332 and s = 0.0116, black). The inset compares the histogram of Hybrid-z photo-z residuals with the fit models in logscale of the y-axis.
Current usage metrics show cumulative count of Article Views (full-text article views including HTML views, PDF and ePub downloads, according to the available data) and Abstracts Views on Vision4Press platform.
Data correspond to usage on the plateform after 2015. The current usage metrics is available 48-96 hours after online publication and is updated daily on week days.
Initial download of the metrics may take a while.