Fig. 5.
Download original image
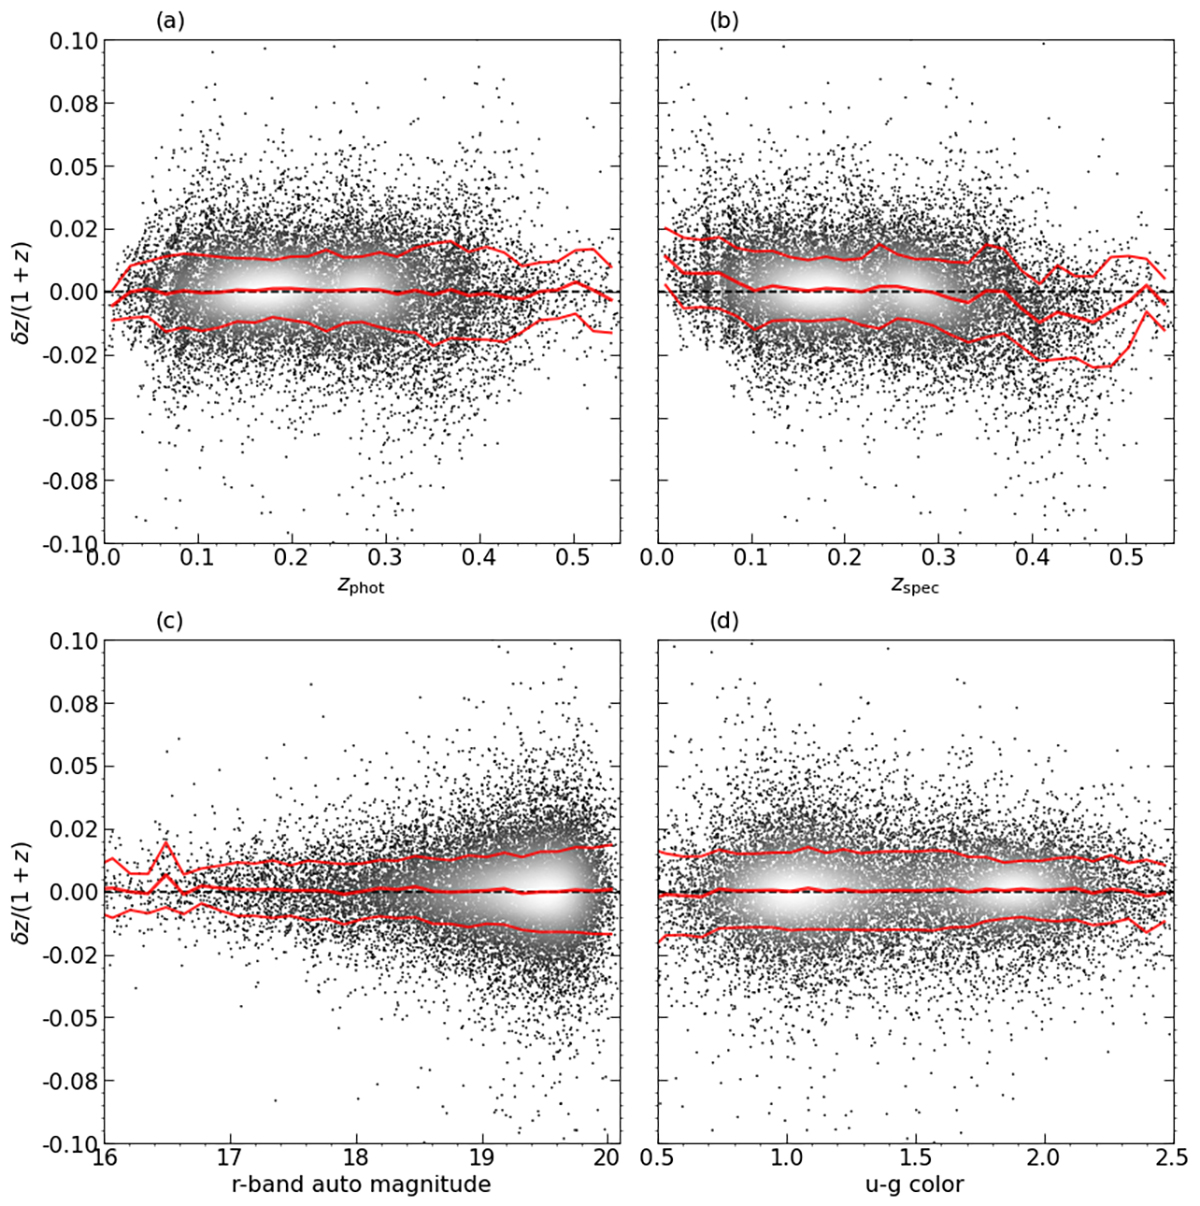
Photometric redshift errors of Hybrid-z as a function of four quantities, from left to right, (a) photometric redshift as derived in this work; (b) true spectroscopic redshift from the clean sample; (c) apparent r-band magnitude; and (d) observed u − g color. The thick solid red line represents the running median, while the thin red lines illustrate the scatter (SMAD), based on a blind test sample derived from GAMA.
Current usage metrics show cumulative count of Article Views (full-text article views including HTML views, PDF and ePub downloads, according to the available data) and Abstracts Views on Vision4Press platform.
Data correspond to usage on the plateform after 2015. The current usage metrics is available 48-96 hours after online publication and is updated daily on week days.
Initial download of the metrics may take a while.