Fig. C.2
Download original image
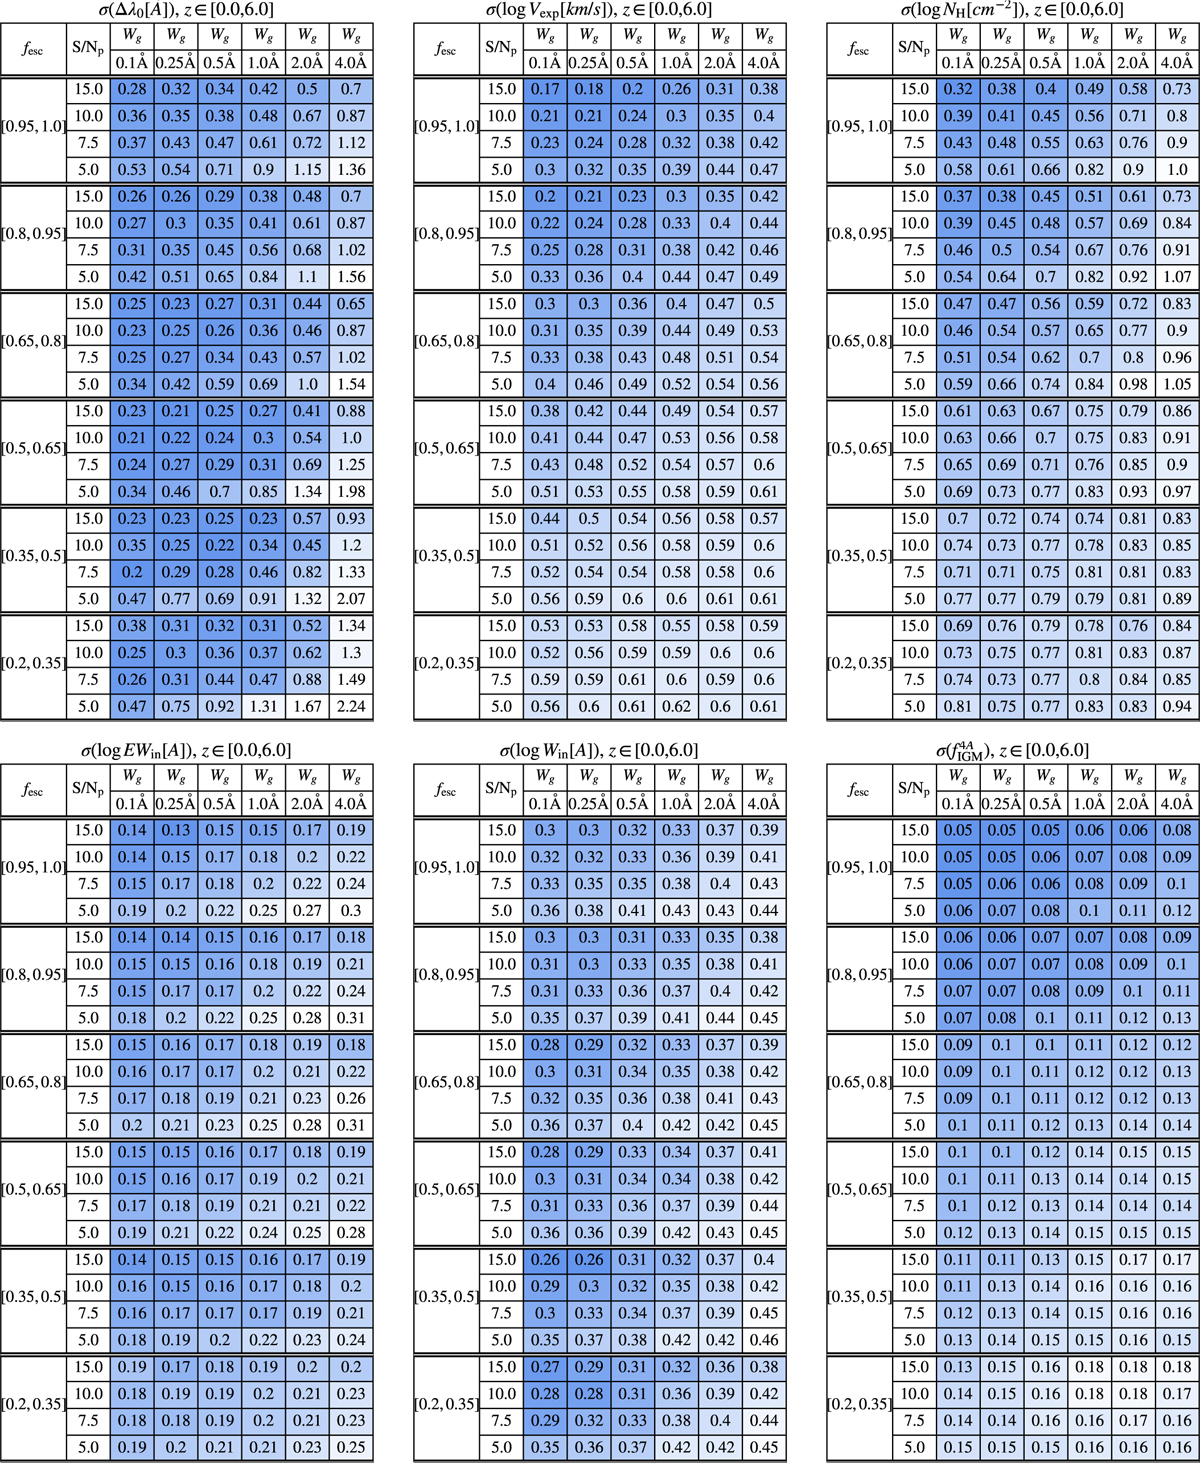
Accuracy measured through the standard deviation of the difference between the true output parameters and those predicted by IGM+z. The top row shows the accuracy in rest frame wavelength of Lyα, the outflow expansion velocity and the outflow neutral hydrogen column density from left to right. In the bottom row we show the accuracy for the intrinsic equivalent width and width before entering into the ISM and ![]() from left to right. This is computed for 6 values of Wg and ΔλPix and 4 of S/Np, i.e., 24 mocks of 10000 Lyα line profiles. These are split by their true
from left to right. This is computed for 6 values of Wg and ΔλPix and 4 of S/Np, i.e., 24 mocks of 10000 Lyα line profiles. These are split by their true ![]() in 6 bins. The color of each cell is shown in darker for smaller values (better accuracy).
in 6 bins. The color of each cell is shown in darker for smaller values (better accuracy).
Current usage metrics show cumulative count of Article Views (full-text article views including HTML views, PDF and ePub downloads, according to the available data) and Abstracts Views on Vision4Press platform.
Data correspond to usage on the plateform after 2015. The current usage metrics is available 48-96 hours after online publication and is updated daily on week days.
Initial download of the metrics may take a while.