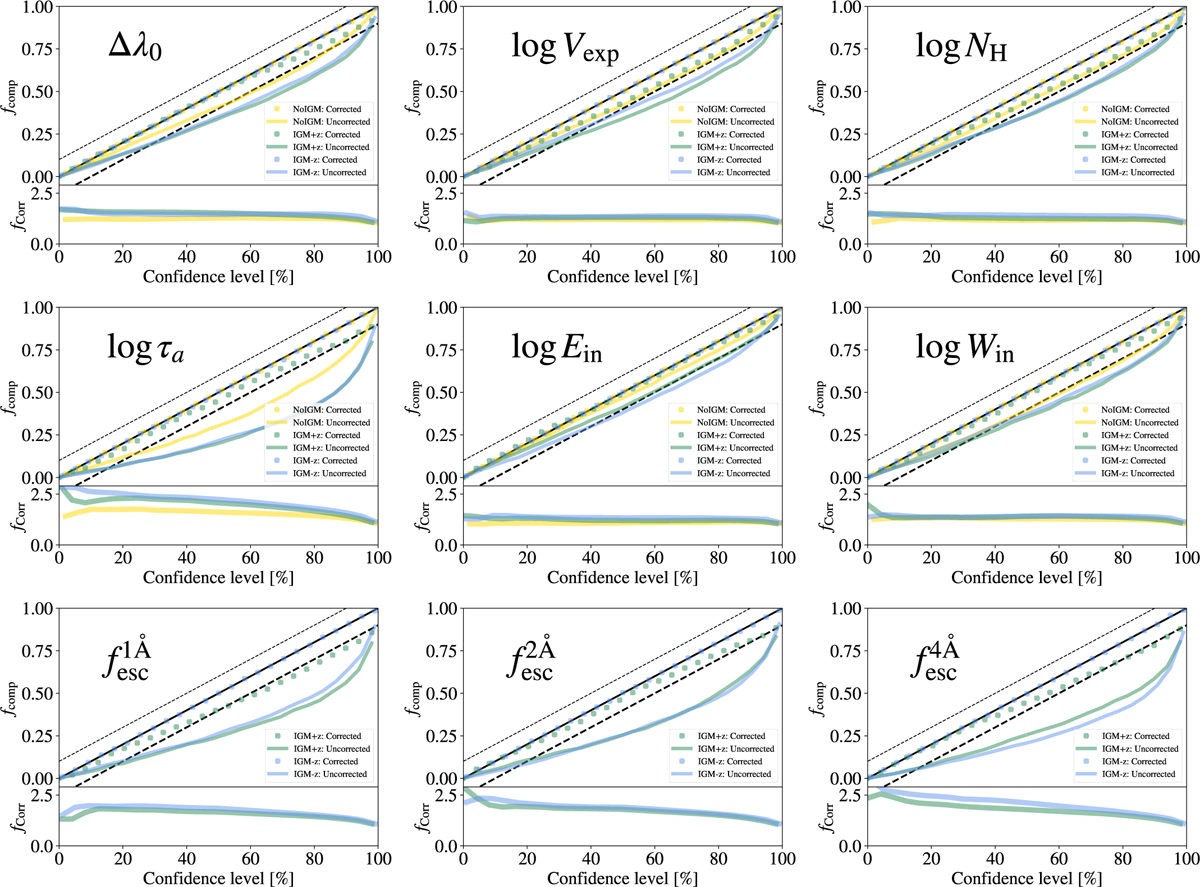
Fig. B.1
Download original image
Top: Comparison between the fraction of cases that a measurement is in agreement with the intrinsic true value, fcomp, as a function of the confidence level. Bottom: Applied correction factor to uncertainty. The uncorrected fcomp is shown in colored solid lines, which IGM+z in green, IGM-z in blue and NoIGM in yellow. fcomp after the correction is shown in colored dots. In each panel a different output property is shown. In the first row zmax, Vexp and NH from left to right. In the second row τa, EWin, Win, from left to right. In the third row ![]() , and
, and ![]() from left to right. The diagonal black dashed lines show the 1:1±10% relation. Computed using 104 line profiles with quality Wg = 0.5 Å, ΔλPix = 0.1 Å and S/Np = 10.
from left to right. The diagonal black dashed lines show the 1:1±10% relation. Computed using 104 line profiles with quality Wg = 0.5 Å, ΔλPix = 0.1 Å and S/Np = 10.
Current usage metrics show cumulative count of Article Views (full-text article views including HTML views, PDF and ePub downloads, according to the available data) and Abstracts Views on Vision4Press platform.
Data correspond to usage on the plateform after 2015. The current usage metrics is available 48-96 hours after online publication and is updated daily on week days.
Initial download of the metrics may take a while.