Fig. 9
Download original image
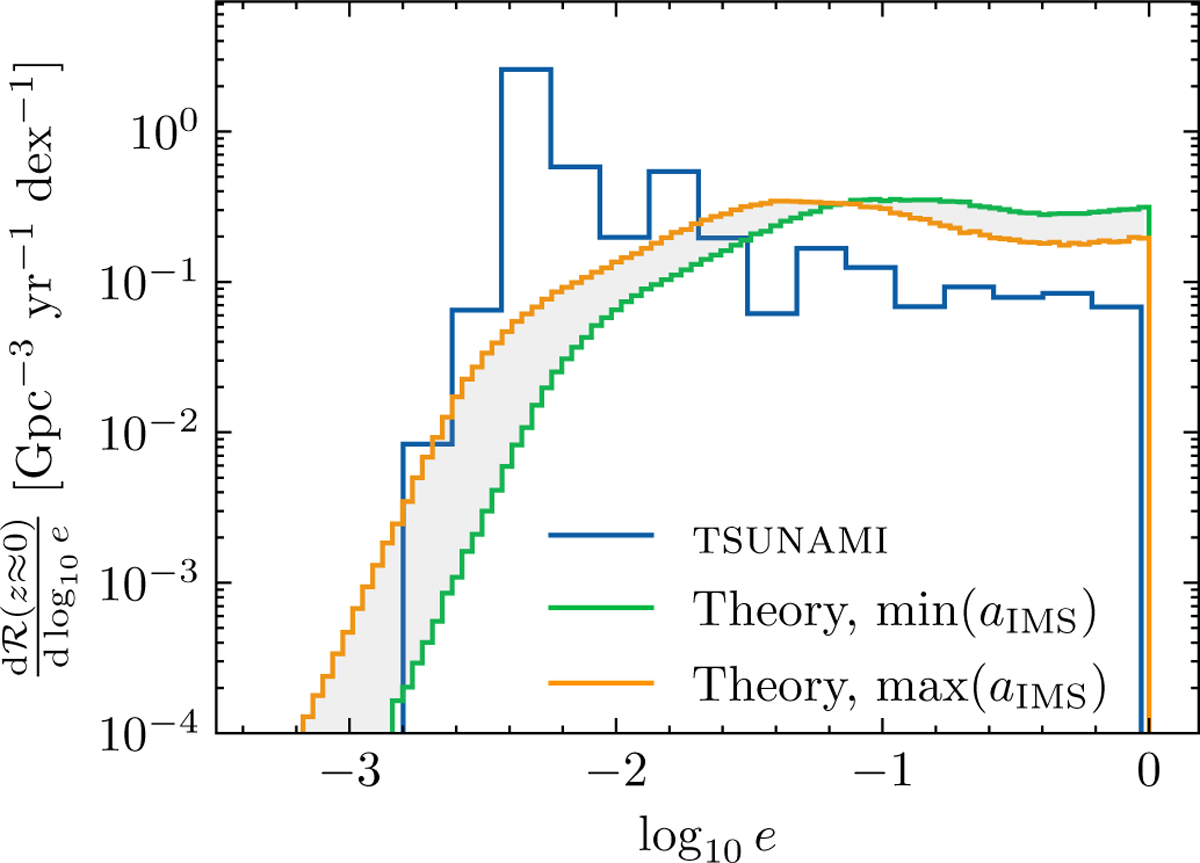
Merger rate due to captures in BBH − BBH interactions as a function of the eccentricity (measured at ![]() , as explained in Sect. 4.5). In blue, the results obtained from the TSUNAMI simulations. In green and yellow, the analytical model of Sections 4.1 and 4.5, obtained from the CMC data, and computed from the minimum and maximum aIMS (Equation (28)), respectively. For clarity, the area between these lines is coloured in light grey.
, as explained in Sect. 4.5). In blue, the results obtained from the TSUNAMI simulations. In green and yellow, the analytical model of Sections 4.1 and 4.5, obtained from the CMC data, and computed from the minimum and maximum aIMS (Equation (28)), respectively. For clarity, the area between these lines is coloured in light grey.
Current usage metrics show cumulative count of Article Views (full-text article views including HTML views, PDF and ePub downloads, according to the available data) and Abstracts Views on Vision4Press platform.
Data correspond to usage on the plateform after 2015. The current usage metrics is available 48-96 hours after online publication and is updated daily on week days.
Initial download of the metrics may take a while.