Fig. 1
Download original image
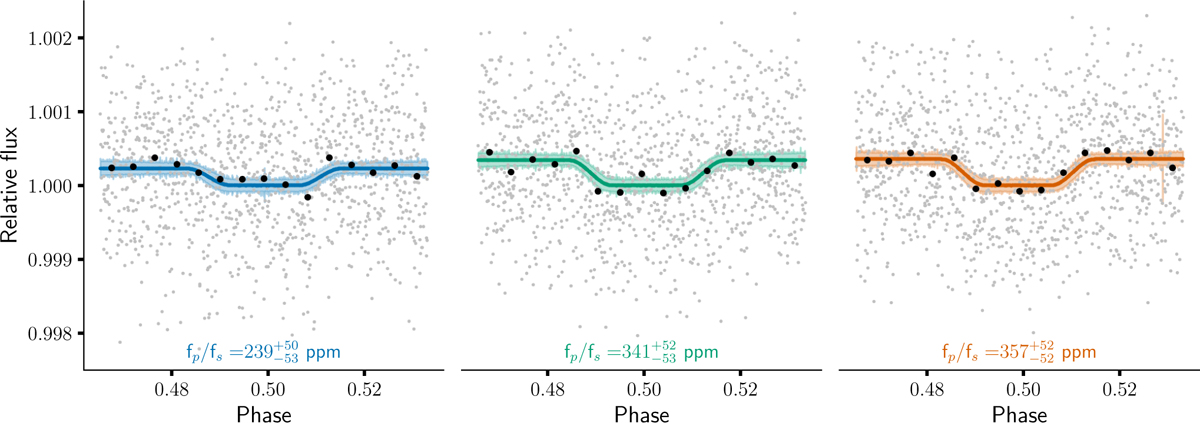
Light curves of TOI-1468 b of individual fits. The left light curve is from visit 1, the middle light curve corresponds to visit 2, and the right light curve is from visit 3. The grey points are detrended flux measurements. The continuous lines show the best-fit occultation models, and the light coloured shaded area is the 95% HDI. Blue corresponds to visit 1, green to visit 2, and orange to visit 3. The black points show the binned data.
Current usage metrics show cumulative count of Article Views (full-text article views including HTML views, PDF and ePub downloads, according to the available data) and Abstracts Views on Vision4Press platform.
Data correspond to usage on the plateform after 2015. The current usage metrics is available 48-96 hours after online publication and is updated daily on week days.
Initial download of the metrics may take a while.