Fig. 7.
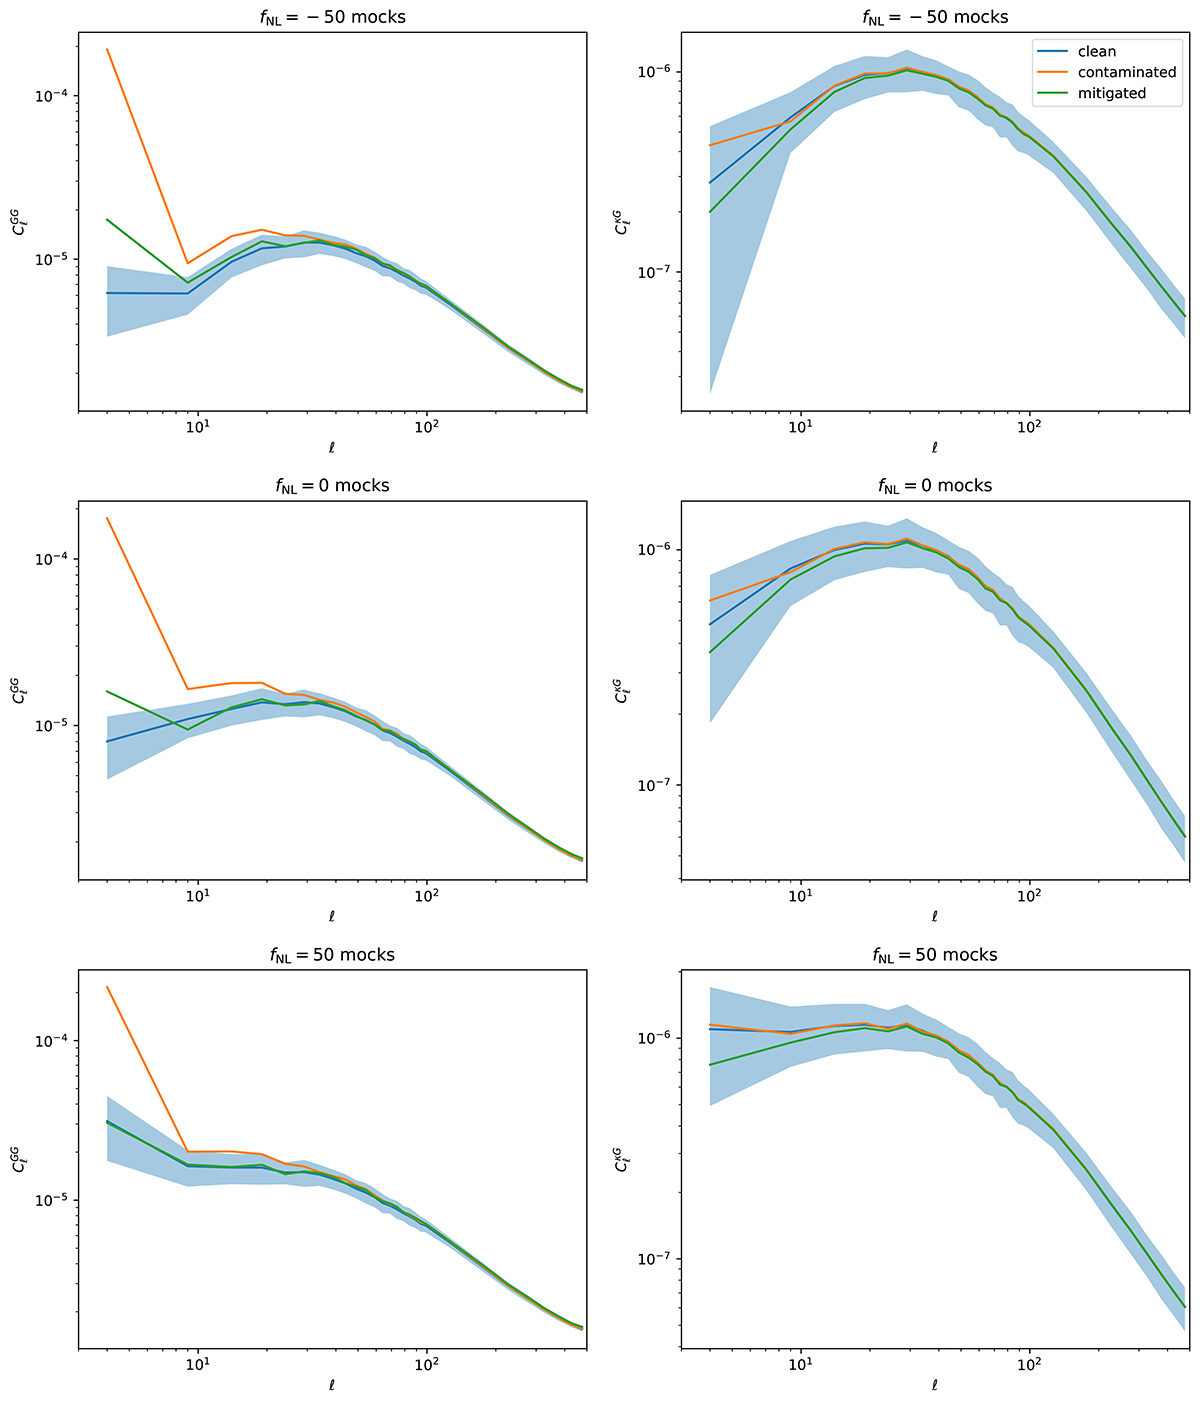
Download original image
Mean angular power spectra of the full sample LRG autocorrelation (left panels) and LRG-CMB lensing cross-correlation (right panels), computed from the 100 mock realizations used to test our pipeline for various values of fNL (−50 top panels, 0 middle panels, and 50 bottom panels). The blue lines show the true angular power spectra before adding contamination, the shaded blue area corresponds to the dispersion on the true spectra, the orange lines correspond to the angular power spectra of the contaminated mocks, and the green lines to the contaminated mocks after imaging systematics mitigation.
Current usage metrics show cumulative count of Article Views (full-text article views including HTML views, PDF and ePub downloads, according to the available data) and Abstracts Views on Vision4Press platform.
Data correspond to usage on the plateform after 2015. The current usage metrics is available 48-96 hours after online publication and is updated daily on week days.
Initial download of the metrics may take a while.