Open Access
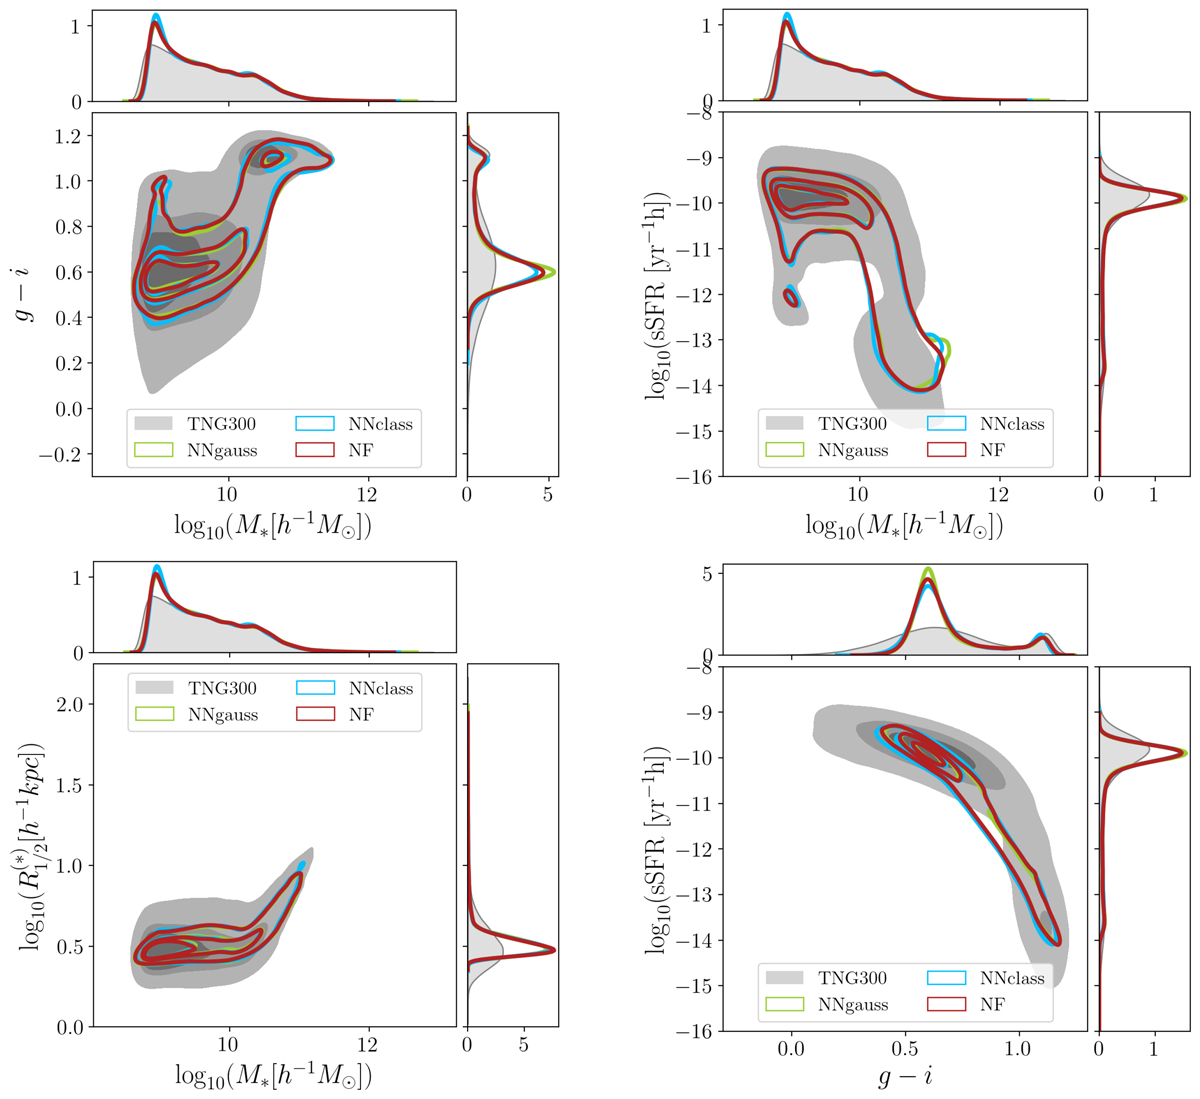
Fig. 5.
Download original image
Contour plots of the single-point estimate catalog of the models (NNgauss, NNclass and NF) compared with the truth distribution of the test set from TNG300. This catalog corresponds to the average over 1000 samples of the predicted distribution.
Current usage metrics show cumulative count of Article Views (full-text article views including HTML views, PDF and ePub downloads, according to the available data) and Abstracts Views on Vision4Press platform.
Data correspond to usage on the plateform after 2015. The current usage metrics is available 48-96 hours after online publication and is updated daily on week days.
Initial download of the metrics may take a while.