Open Access
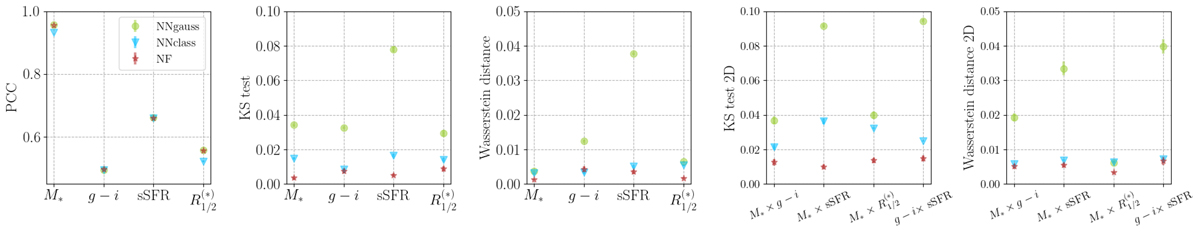
Fig. 4.
Download original image
Comparison between the machine learning methods NNgauss, NNclass and NF in terms of the metrics introduced in Sect. 5. The error bars correspond to the standard deviation over multiple catalogs sampled from the predicted distributions. The 2D scores are computed with a random sub-sample from the test set.
Current usage metrics show cumulative count of Article Views (full-text article views including HTML views, PDF and ePub downloads, according to the available data) and Abstracts Views on Vision4Press platform.
Data correspond to usage on the plateform after 2015. The current usage metrics is available 48-96 hours after online publication and is updated daily on week days.
Initial download of the metrics may take a while.