Fig. 1.
Download original image
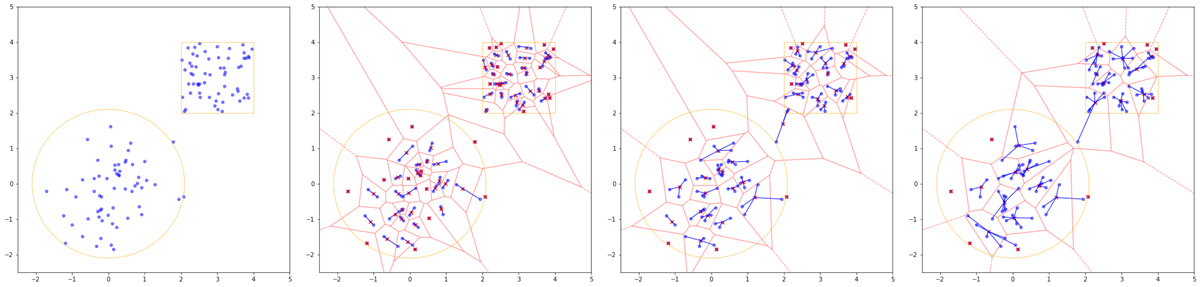
Illustration of the HiVAl method. The first panel shows samples of two distributions as blue dots. The yellow lines are simply guides for the boundaries of the two disjoint distributions used in this example. The second panel (from left to right) shows the first iteration of HiVAl: the red crosses represent new particles (centers of cells) created by combining pairs of the original particles, and the red lines represent the boundaries of the cells. The blue lines indicate which of the original particles have been grouped together (the group being represented by the red cross). The third panel shows the second iteration of HiVAl: center of cells from the previous iteration, represented by red crosses, are once again combined in pairs to create new cells. The combined particles are connected by blue lines, therefore, in this iteration there are more particles connected as compared to previous one. The fourth panel shows the third iteration of HiVAl in this example. It follows the same reasoning as the previous panels.
Current usage metrics show cumulative count of Article Views (full-text article views including HTML views, PDF and ePub downloads, according to the available data) and Abstracts Views on Vision4Press platform.
Data correspond to usage on the plateform after 2015. The current usage metrics is available 48-96 hours after online publication and is updated daily on week days.
Initial download of the metrics may take a while.