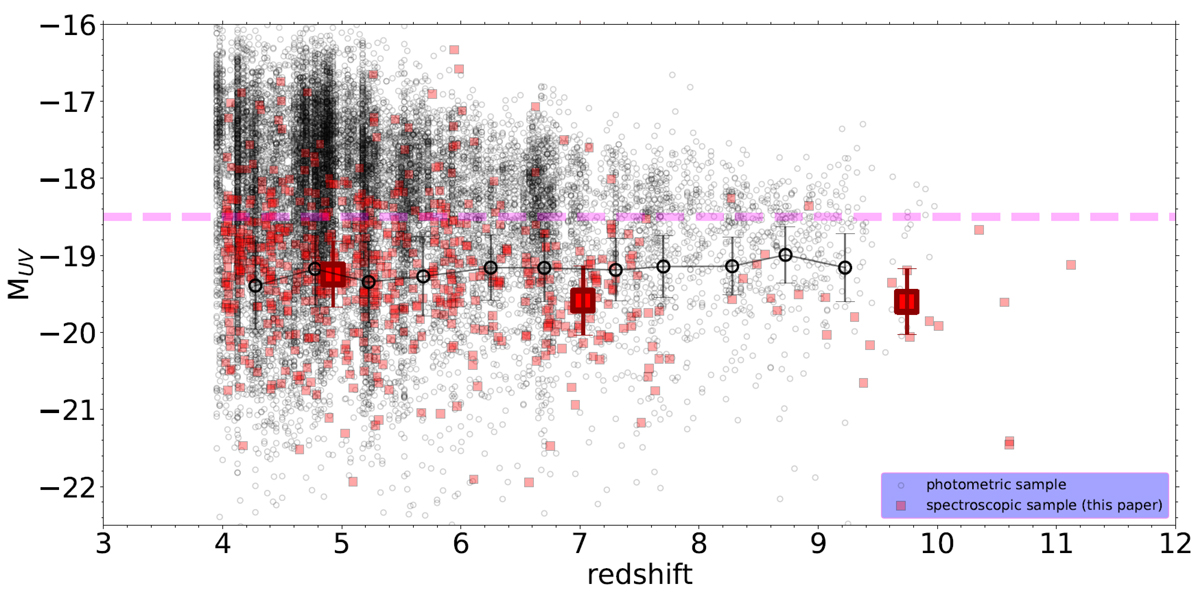
Fig. A.1.

Download original image
MUV and redshift distribution of our spectroscopic sample (small red squares). We compared our sample with a photometric one (small black open circles), selected with a magnitude cut of 29.5 in the F277W filter. The big red squares and the big black open circles represents the medians and median absolute deviation of MUV in the same bins of redshift used in this paper (z < 6.5, 6.5 < z < 8.5 and z > 8.5) for our spectroscopic sample and the photometric one, respectively. In both cases, we considered only galaxies brighter than MUV, lim = −18.5 (shown as the dotted pink line).
Current usage metrics show cumulative count of Article Views (full-text article views including HTML views, PDF and ePub downloads, according to the available data) and Abstracts Views on Vision4Press platform.
Data correspond to usage on the plateform after 2015. The current usage metrics is available 48-96 hours after online publication and is updated daily on week days.
Initial download of the metrics may take a while.


