Fig. 5.
Download original image
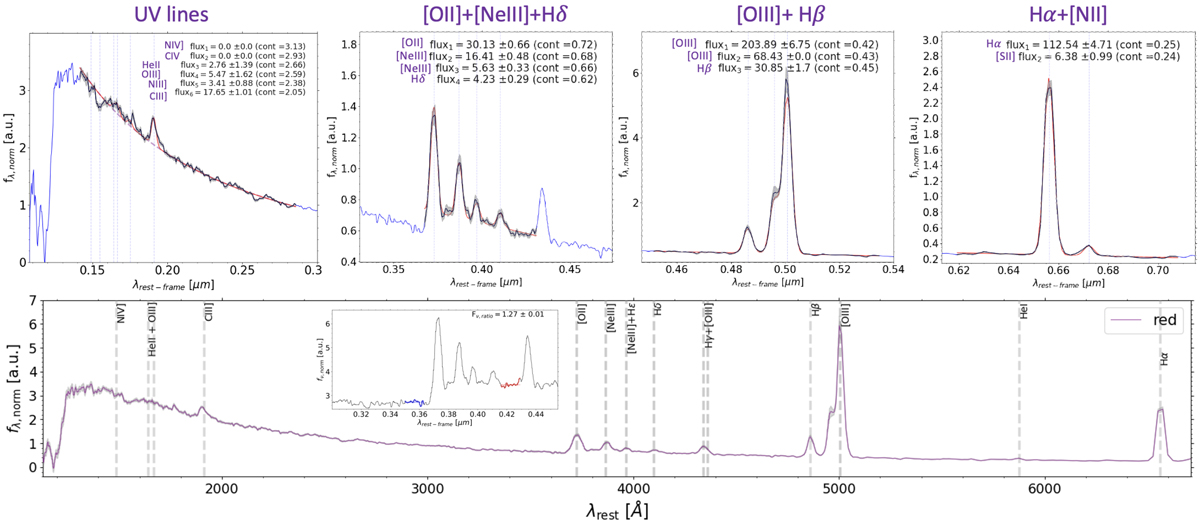
Spectral stacks of the red galaxy population, as defined in the text, between 1150 and 6700 Å rest-frame. The position of several UV and optical lines is indicated with vertical gray dashed lines. The same panel shows the fit for deriving the optical break. On top of the stack the fit of the UV lines, the [O II] λ3727 Å+[Ne III] λ3868 Å+Hδ lines, the [O III] λ5007 Å+Hβ triplet, and the Hα+[S II] λλ6717 − 6731 lines, as detailed in the text, are shown. The full spectrum is indicated with a blue solid line. The black spectrum is the fitted region, and the red curve represents the best-fit profile. In each panel, fluxes, 1σ uncertainties, and underlying continuum are also indicated for each of the fitted lines highlighted with thin vertical dashed lines.
Current usage metrics show cumulative count of Article Views (full-text article views including HTML views, PDF and ePub downloads, according to the available data) and Abstracts Views on Vision4Press platform.
Data correspond to usage on the plateform after 2015. The current usage metrics is available 48-96 hours after online publication and is updated daily on week days.
Initial download of the metrics may take a while.