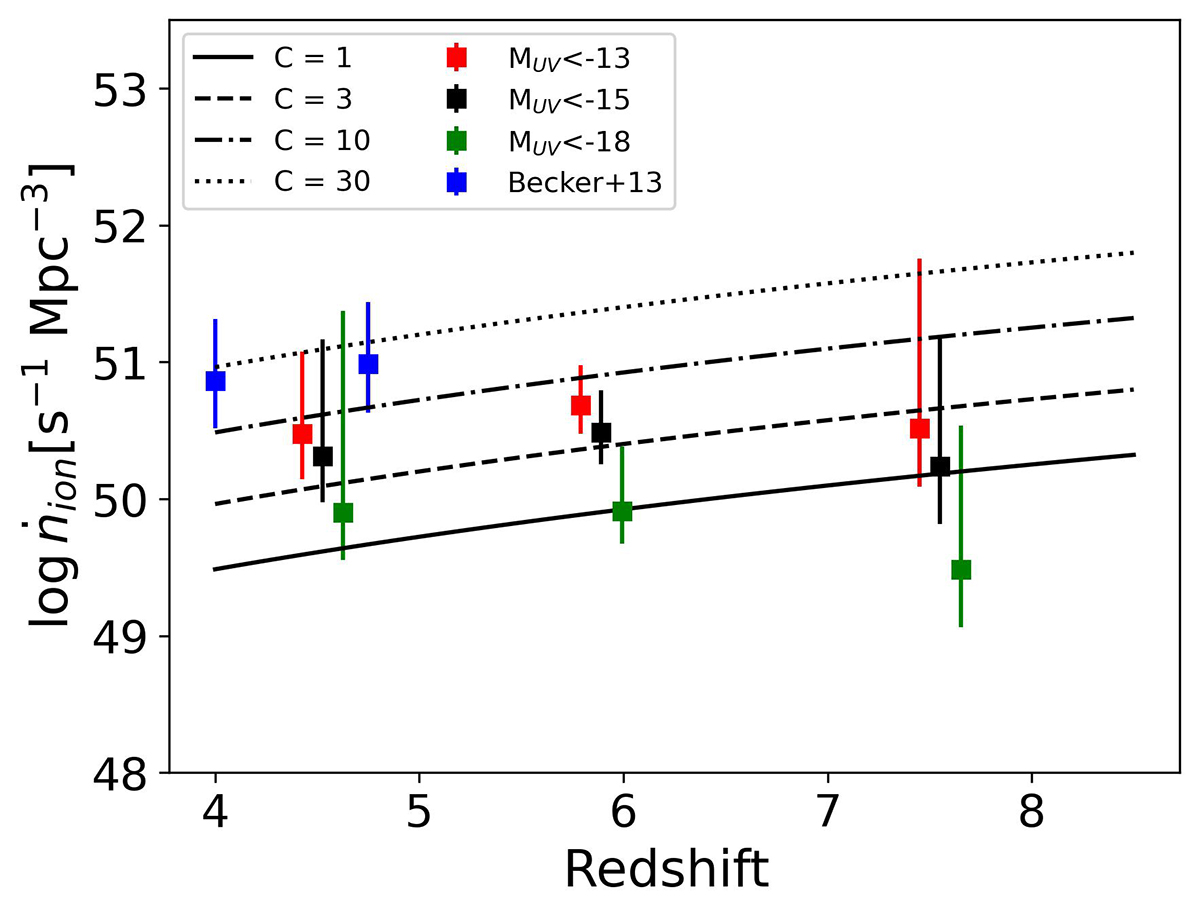
Fig. 7.
Download original image
Evolution of the total ionizing emissivity. The red, black, and green squares are our estimations after integrating from MUV = −23 to MUV = −13, MUV = −15, and MUV = −18, respectively. The black and green squares are shifted by 0.1 and 0.2 in redshift, respectively, for better visualization. The different lines represent IGM evolution models from Madau et al. (1999) for different ionized hydrogen clumping factors C. The blue squares are observational constraints obtained by observing the Lyα forest from Becker & Bolton (2013).
Current usage metrics show cumulative count of Article Views (full-text article views including HTML views, PDF and ePub downloads, according to the available data) and Abstracts Views on Vision4Press platform.
Data correspond to usage on the plateform after 2015. The current usage metrics is available 48-96 hours after online publication and is updated daily on week days.
Initial download of the metrics may take a while.