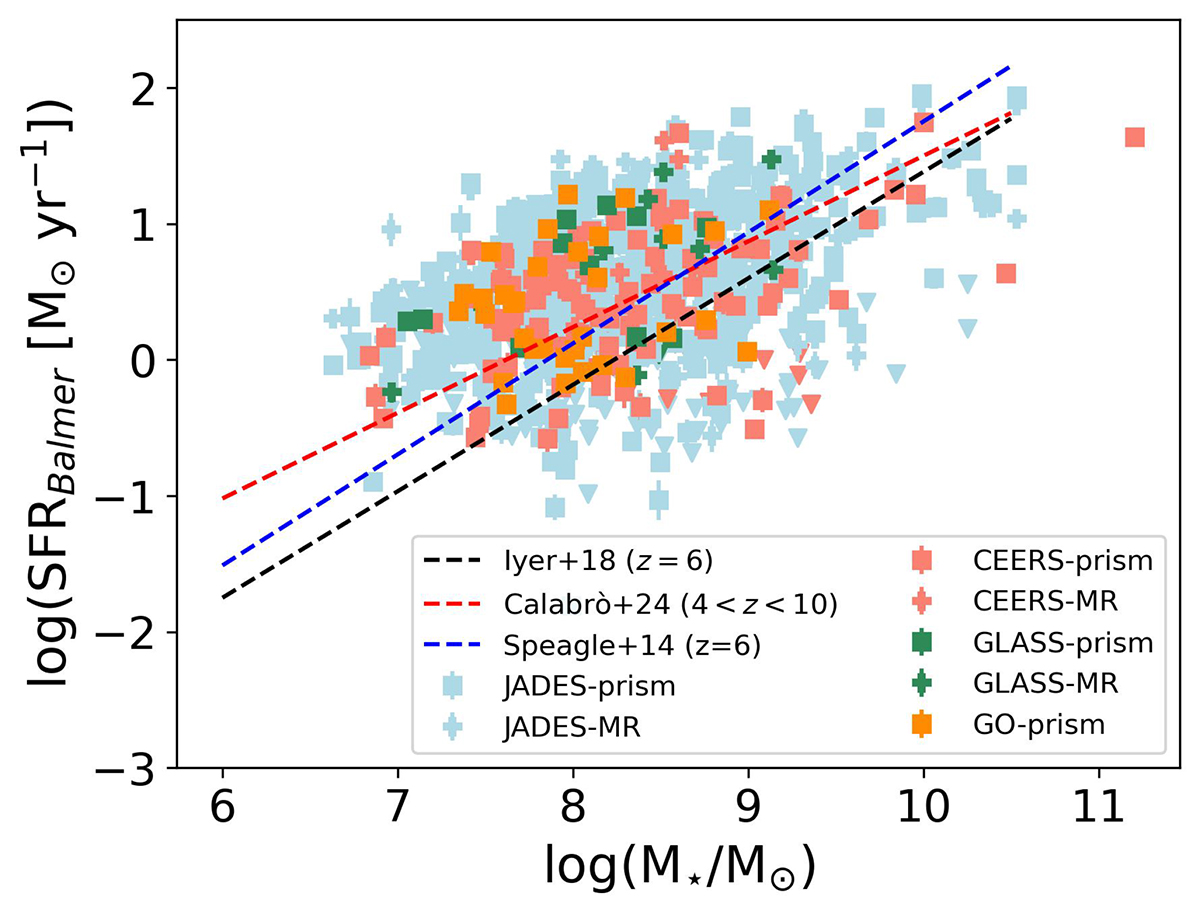
Fig. 2.
Download original image
Distribution of the full sample along the stellar mass-SFR plane. The dashed black and blue lines are the main-sequence of star-forming galaxies at z = 6 from Iyer et al. (2018) and Speagle et al. (2014), respectively. While the dashed red line represents the main-sequence at 4 < z < 10 from Calabrò et al. (2024b). The triangle symbols are upper limits based on Hα or on Hβ if an upper limit on Hα is not estimated.
Current usage metrics show cumulative count of Article Views (full-text article views including HTML views, PDF and ePub downloads, according to the available data) and Abstracts Views on Vision4Press platform.
Data correspond to usage on the plateform after 2015. The current usage metrics is available 48-96 hours after online publication and is updated daily on week days.
Initial download of the metrics may take a while.