Fig. A.1.
Download original image
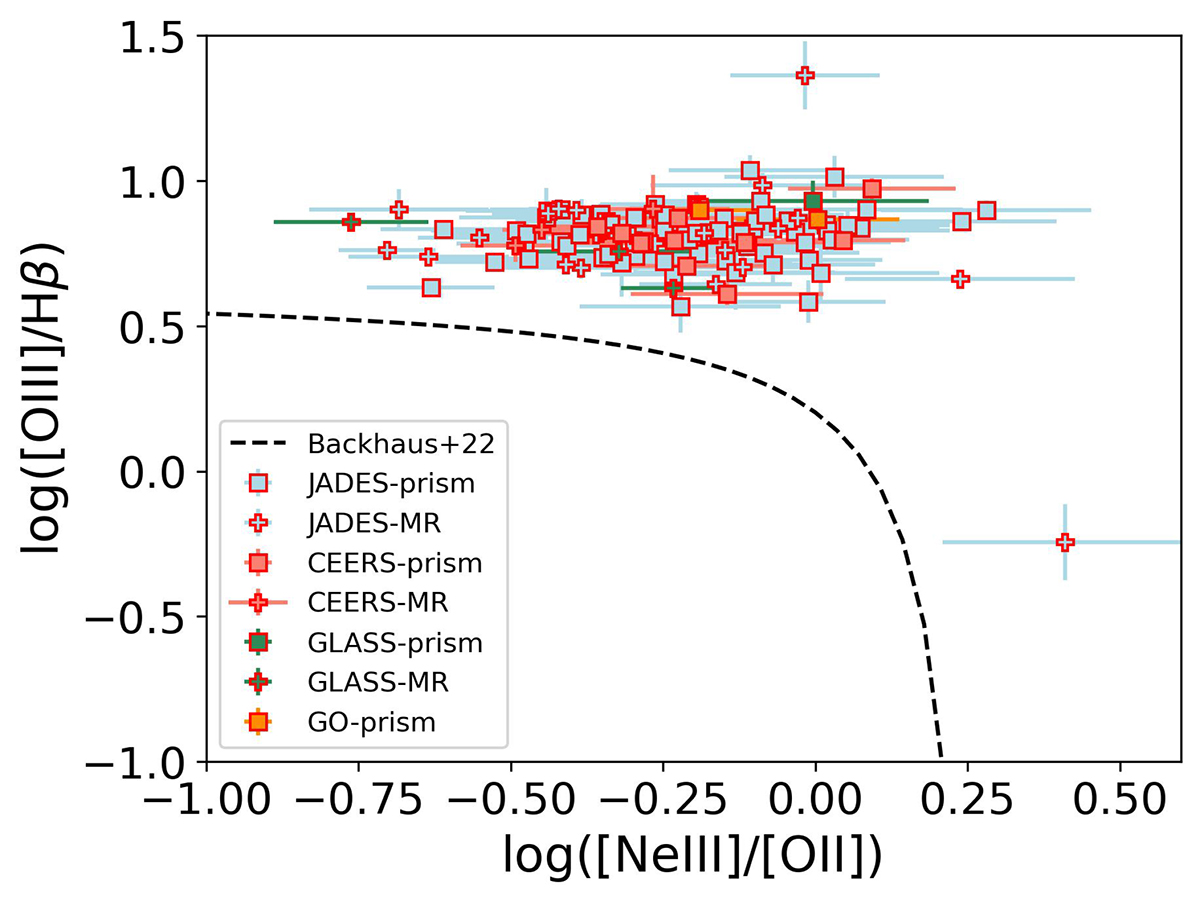
OHNO diagram for the galaxies in our sample. The symbols are the same as in Fig. 4. The dashed line indicates the demarcation line from Backhaus et al. (2022) to separate star-forming galaxies from AGNs. The AGN region lies above this line based on this diagnostic. Based on this diagnostic diagram, AGN candidates are shown as symbols with red edges.
Current usage metrics show cumulative count of Article Views (full-text article views including HTML views, PDF and ePub downloads, according to the available data) and Abstracts Views on Vision4Press platform.
Data correspond to usage on the plateform after 2015. The current usage metrics is available 48-96 hours after online publication and is updated daily on week days.
Initial download of the metrics may take a while.