Fig. 10.
Download original image
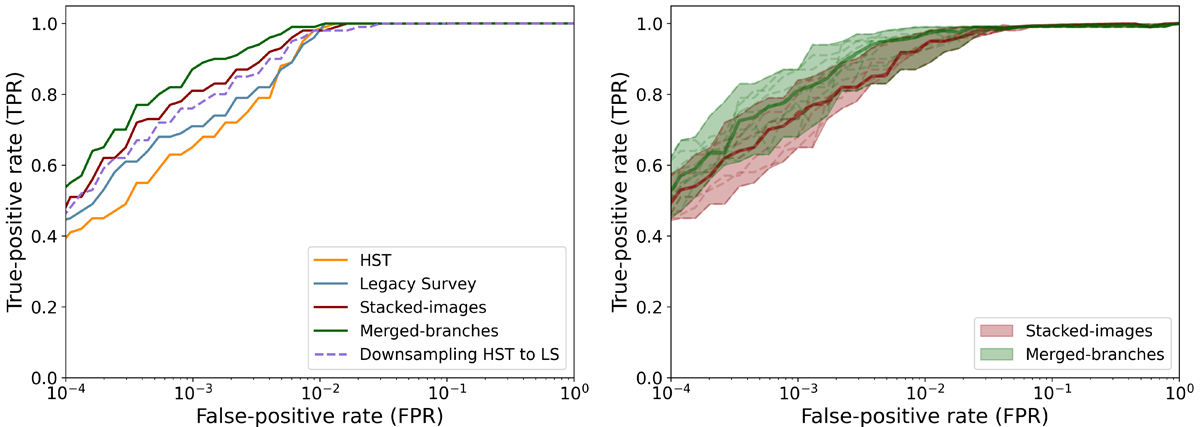
ROC curves of different network architectures. Left panel: our four main networks illustrated in Fig. 7 (solid lines), and the network that downsampled HST F814W to LS (dashed purple line). Right panel: ten different test sets for the stacked-images and merged-branches network, illustrating that the merged-branches network overall performs better than the stacked-images network.
Current usage metrics show cumulative count of Article Views (full-text article views including HTML views, PDF and ePub downloads, according to the available data) and Abstracts Views on Vision4Press platform.
Data correspond to usage on the plateform after 2015. The current usage metrics is available 48-96 hours after online publication and is updated daily on week days.
Initial download of the metrics may take a while.