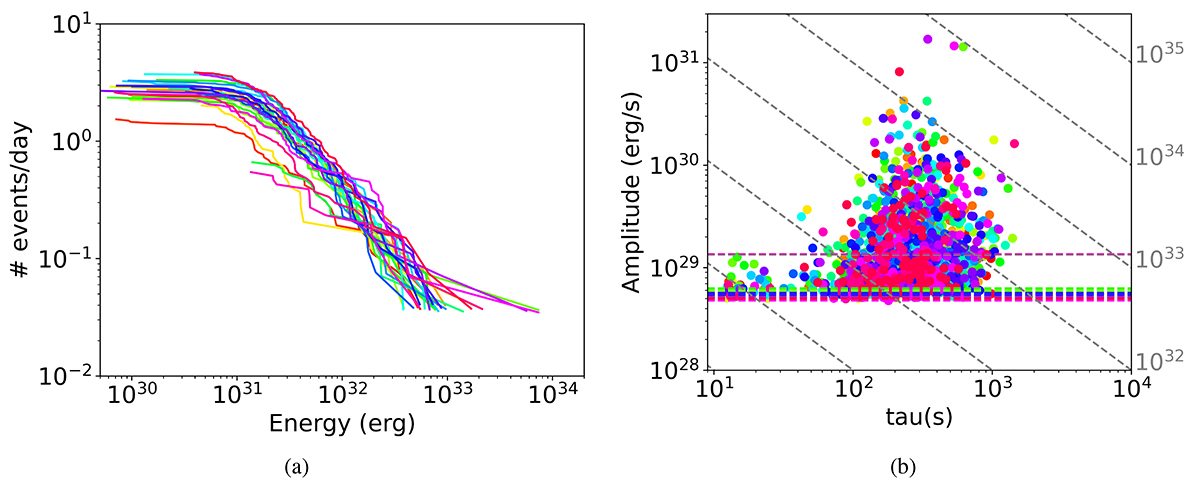
Fig. 8.
Download original image
(a) Cumulative events per day vs. energy for each sector of G 227-22. Between 2 and 4 events per day are detected with energies ≥ 1031 erg. (b) Amplitude vs. τ for events in G 227-22. The colored horizontal lines indicate the value of 3σ used to discriminate events from noise, while the gray oblique lines represent isoenergetic lines.
Current usage metrics show cumulative count of Article Views (full-text article views including HTML views, PDF and ePub downloads, according to the available data) and Abstracts Views on Vision4Press platform.
Data correspond to usage on the plateform after 2015. The current usage metrics is available 48-96 hours after online publication and is updated daily on week days.
Initial download of the metrics may take a while.