Open Access
Fig. 5.
Download original image
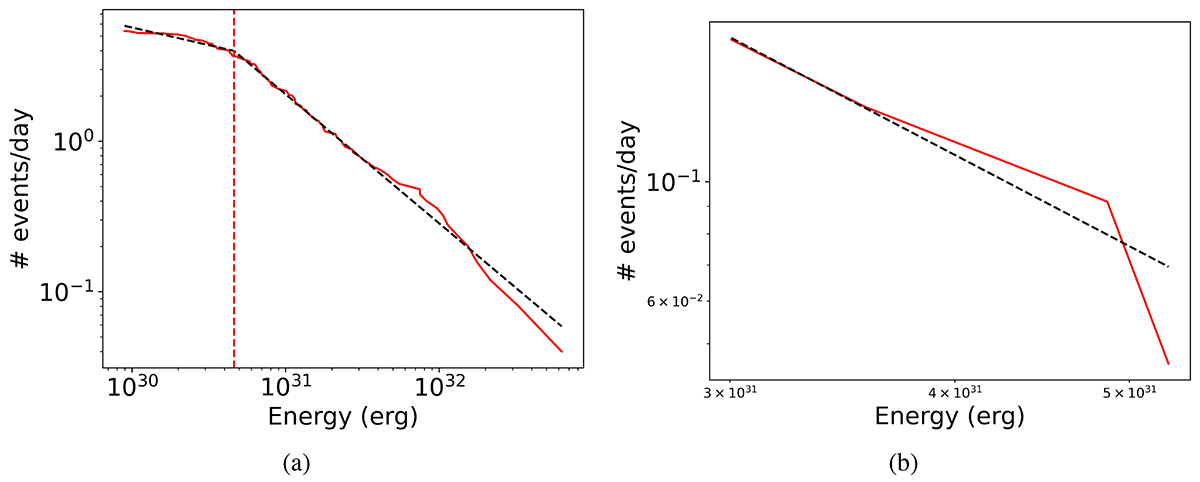
Examples of the fitting method: (a) Two-segment fit. The red line is the example of a cumulative curve of a star in a given sector, the black dashed lines represent the fit and the red dashed vertical line represents the break point. (b) Analogous to panel (a), showing a one-segment fit.
Current usage metrics show cumulative count of Article Views (full-text article views including HTML views, PDF and ePub downloads, according to the available data) and Abstracts Views on Vision4Press platform.
Data correspond to usage on the plateform after 2015. The current usage metrics is available 48-96 hours after online publication and is updated daily on week days.
Initial download of the metrics may take a while.