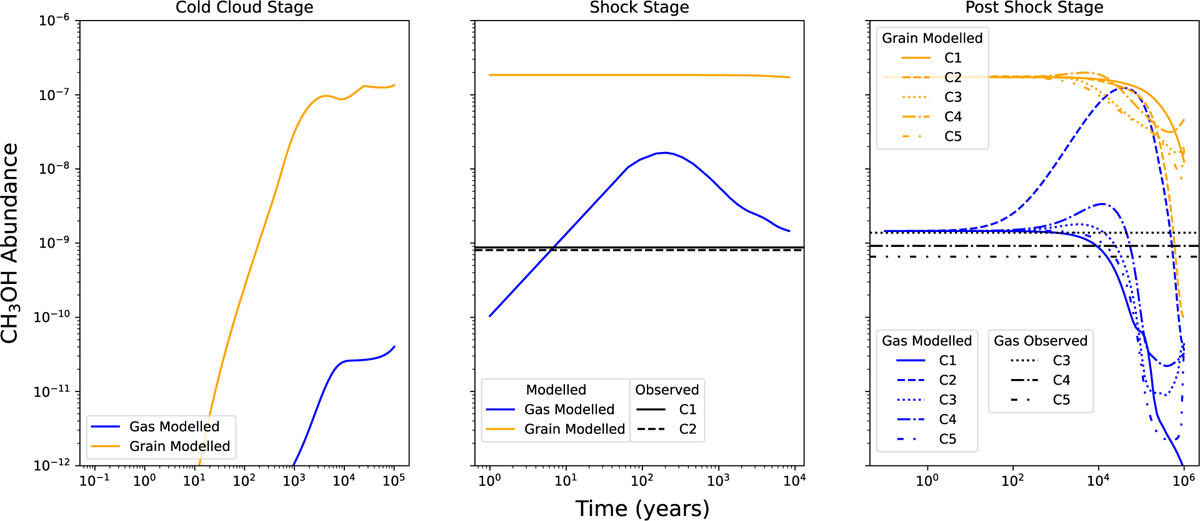
Fig. 8
Download original image
Model B, the three-stage shock model, for CH3OH, simulating a shock. The 10 K cold cloud stage (left) is followed by a sharp increase in density and temperature to simulate a shock (middle) and then a post-shock stage (right), when the gas settles to the LTE conditions observed. The time axis represents the age of each component independently. The LTE components are separated based on their temperatures and densities. The components of each model are in dotted, dashed, or solid lines; blue lines are the model abundances in the gas phase, yellow the model abundances in the grain phase, and black the observed abundances calculated from the averages in Table 2. As C1 and C2 are warmer, we suggest they are still in the shock stage, whereas the cooler C3, C4, and C5 are in a post-shock state.
Current usage metrics show cumulative count of Article Views (full-text article views including HTML views, PDF and ePub downloads, according to the available data) and Abstracts Views on Vision4Press platform.
Data correspond to usage on the plateform after 2015. The current usage metrics is available 48-96 hours after online publication and is updated daily on week days.
Initial download of the metrics may take a while.