Fig. 3
Download original image
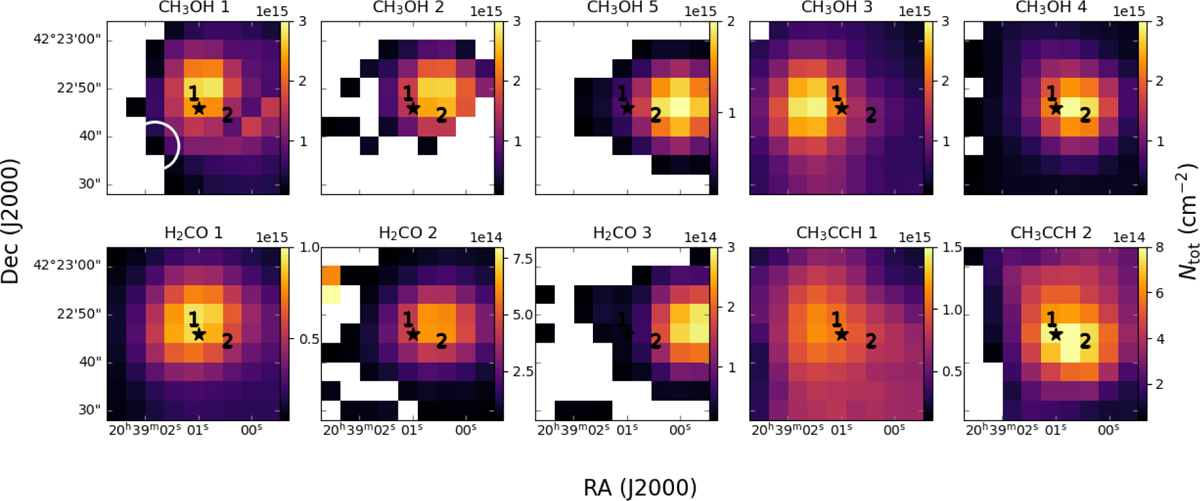
Column density maps, as resulting from an LTE model, for all species (rows) in components (columns) of N44. The cores SMA 7 in MM1 and SMA 3 in MM2 are labelled ‘1’ and ‘2’, respectively, and the clump of N44 is marked by a star (as designated in Zapata et al. 2012 and Motte et al. 2007). CH3OH 5 has been moved to align with H2CO 3, the broad components. Values for all LTE model parameters are listed in Table 2.
Current usage metrics show cumulative count of Article Views (full-text article views including HTML views, PDF and ePub downloads, according to the available data) and Abstracts Views on Vision4Press platform.
Data correspond to usage on the plateform after 2015. The current usage metrics is available 48-96 hours after online publication and is updated daily on week days.
Initial download of the metrics may take a while.