Open Access
Fig. 2
Download original image
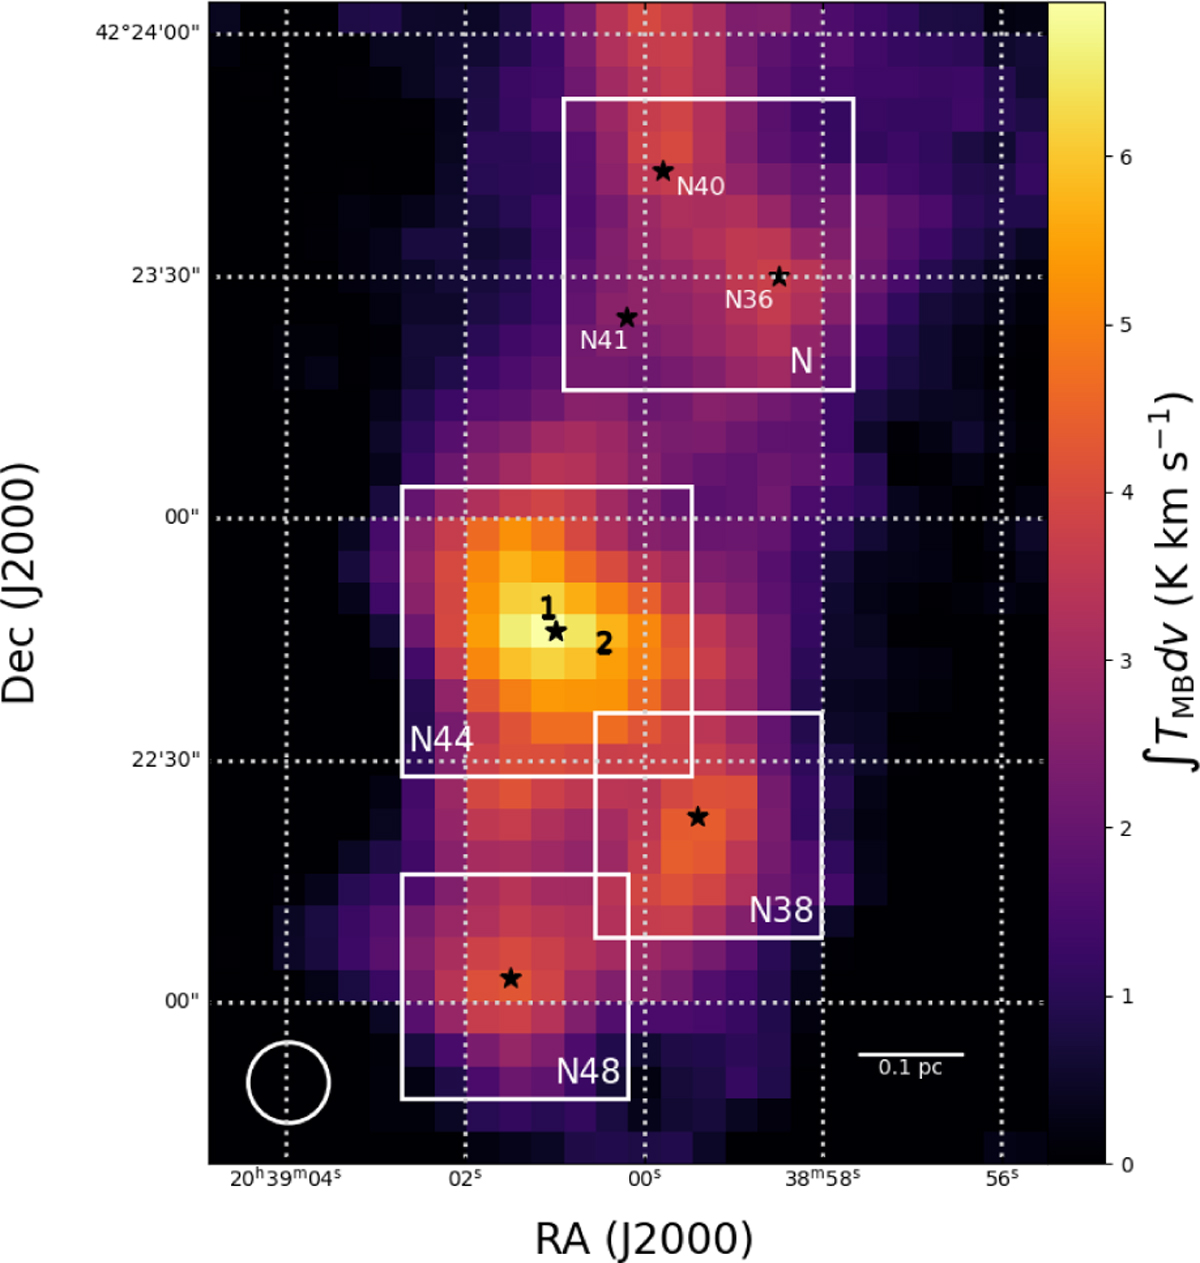
Regions isolated for LTE modelling near and in DR 21(OH), marked in white boxes over an integrated intensity map of the 12 K CH3CCH 50−40 line. From the top, the regions include: N40, N36, and N41 (labelled N); N44; N38; and N48. The dense clumps, as designated by Motte et al. (2007), are marked by stars.
Current usage metrics show cumulative count of Article Views (full-text article views including HTML views, PDF and ePub downloads, according to the available data) and Abstracts Views on Vision4Press platform.
Data correspond to usage on the plateform after 2015. The current usage metrics is available 48-96 hours after online publication and is updated daily on week days.
Initial download of the metrics may take a while.