Open Access
Fig. B.1.
Download original image
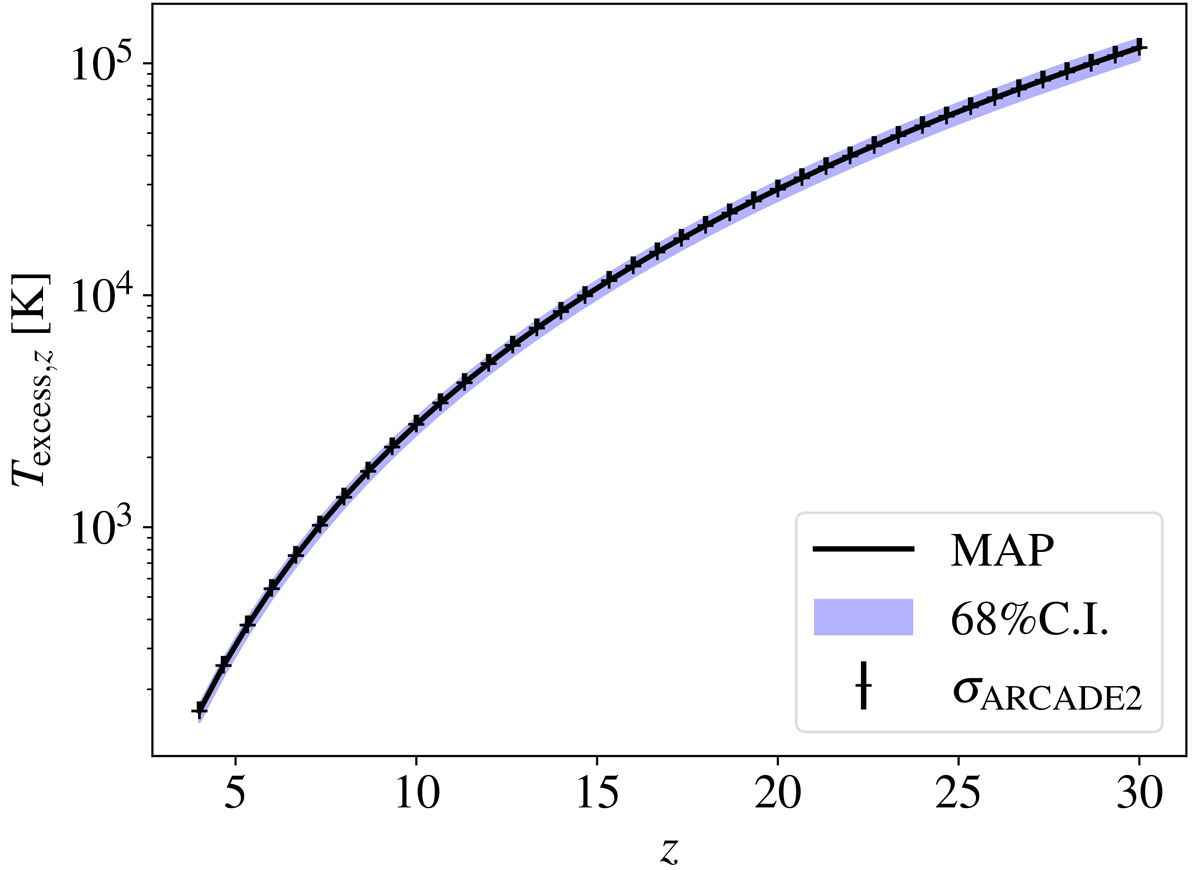
Posteriors of radio excess level inferred from ARCADE2 datasets, the black solid curve shows the MAP results, and blue filled contour shows the 68% C.I. region, the black error bars show the error σARCADE2 used for our ARCADE2 likelihood in Eq. (38).
Current usage metrics show cumulative count of Article Views (full-text article views including HTML views, PDF and ePub downloads, according to the available data) and Abstracts Views on Vision4Press platform.
Data correspond to usage on the plateform after 2015. The current usage metrics is available 48-96 hours after online publication and is updated daily on week days.
Initial download of the metrics may take a while.