Fig. A.3
Download original image
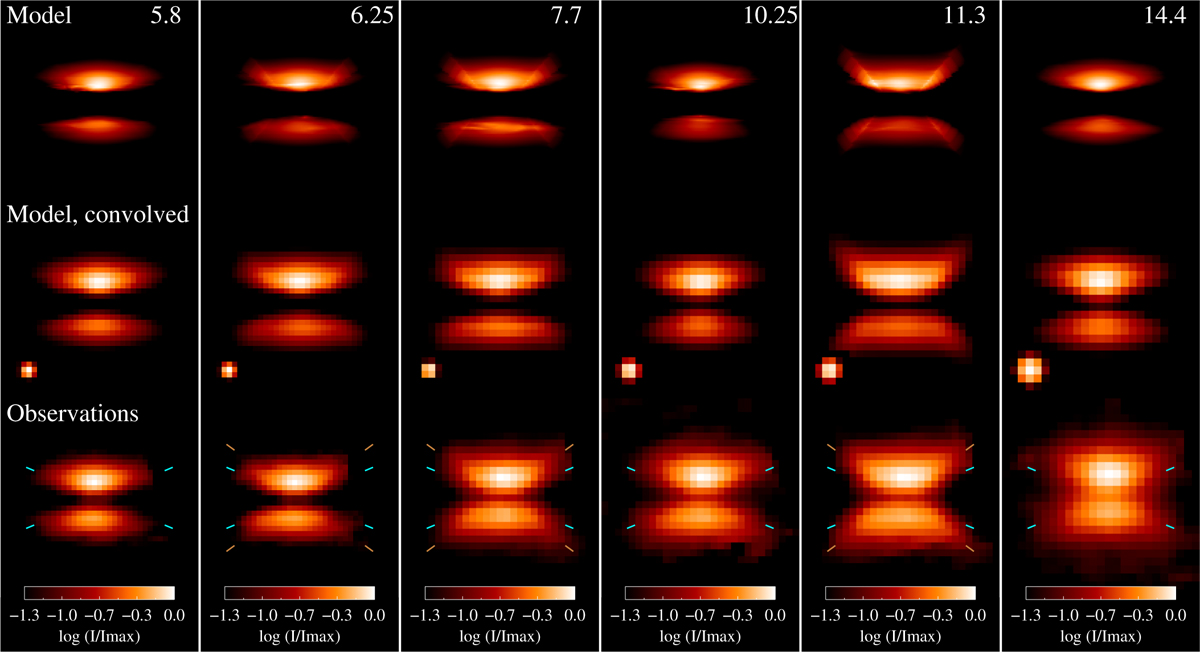
Benchmark model including an astro-PAHs wind component as in Fig. 16 coded with a single red temperature color table. (upper) Model images at full resolution for selected wavelengths spanning the MIR for bands including astro-PAHs contributions (6.25, 7.7, 11.3 μm) or bands representing adjacent bands with more continuum (5.8, 10.25, 14.4 μm) for comparison. (middle) Model images once convolved with JWST PSF. Note the alternance of more rounded shape for continuum dominated bands and chalice/hourglass shape for the one with astro-PAHs contribution. (lower row) observed MIRI images. The colorbars indicate the intensity levels, normalised to the maximum intensity for each image, in log scale.
Current usage metrics show cumulative count of Article Views (full-text article views including HTML views, PDF and ePub downloads, according to the available data) and Abstracts Views on Vision4Press platform.
Data correspond to usage on the plateform after 2015. The current usage metrics is available 48-96 hours after online publication and is updated daily on week days.
Initial download of the metrics may take a while.