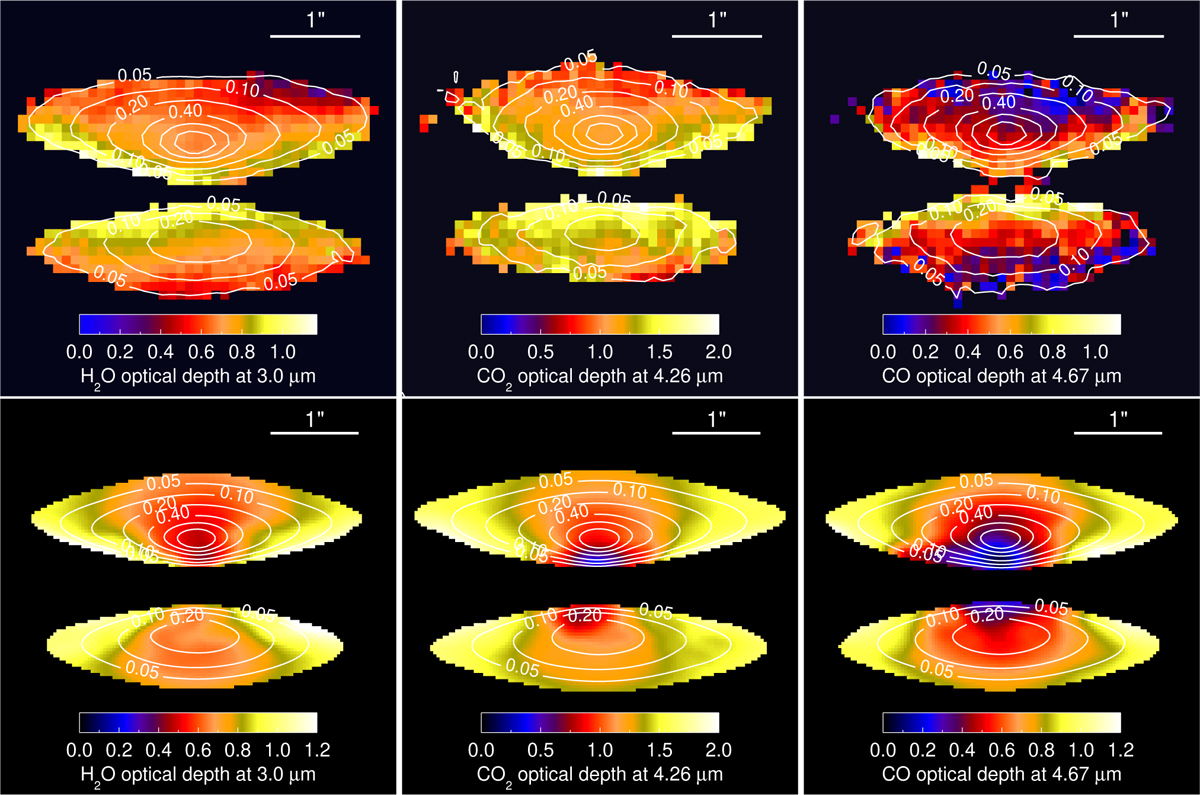
Fig. 12
Download original image
Upper row: reproduction of Fig. 2, observed ice optical depth mapped images. Lower row: benchmark model optical depth images of the disc in H2O, CO2, and CO, as derived at 3.0, 4.26, 4.67 μm calculated against the reference continuum intensities taken at 3.7, 4.32, 4.72 μm, respectively. Over-plotted white contours show the flux intensities at the band centres, normalised to their maximum in the map. The last contour is at 5% from the maximum which is approximately the limit achieved in the observations.
Current usage metrics show cumulative count of Article Views (full-text article views including HTML views, PDF and ePub downloads, according to the available data) and Abstracts Views on Vision4Press platform.
Data correspond to usage on the plateform after 2015. The current usage metrics is available 48-96 hours after online publication and is updated daily on week days.
Initial download of the metrics may take a while.