Fig. 4.
Download original image
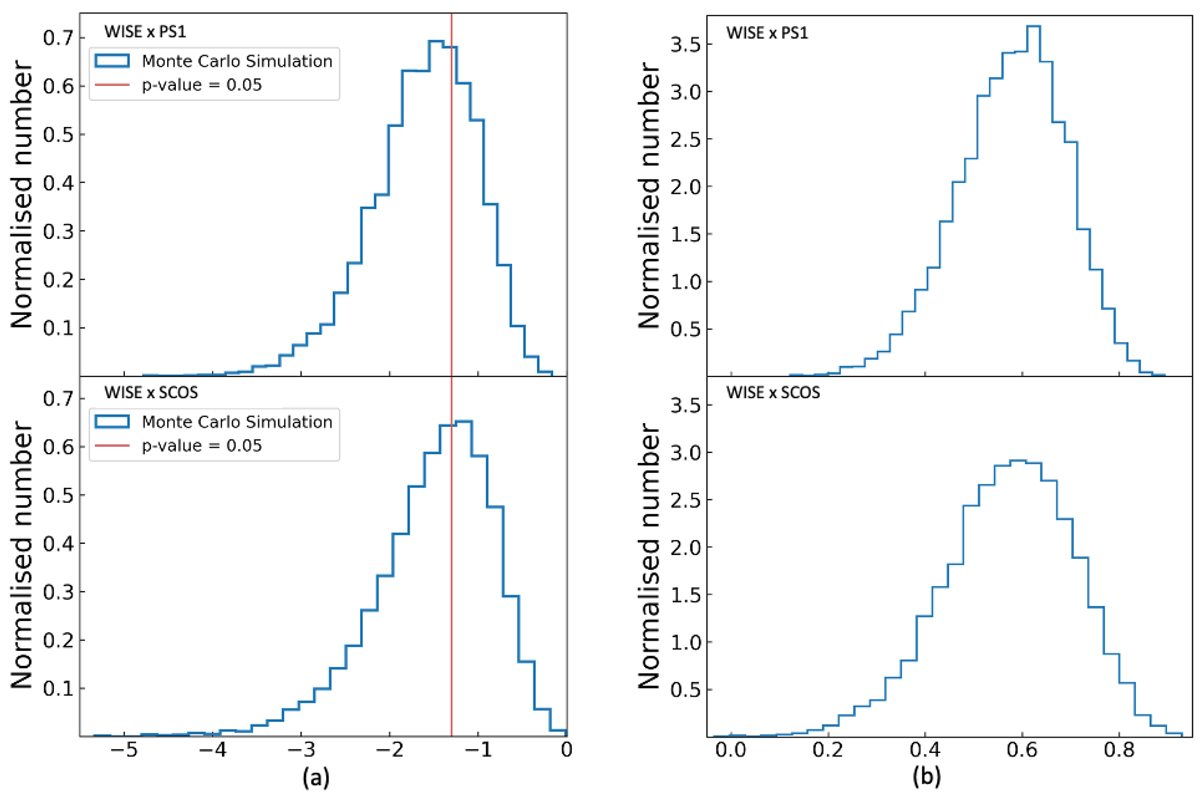
Left panels: histograms of the p values derived from the Monte Carlo simulations to test the statistical significance of the correlation between the deviation of DMcosmic (ΔDMcosmic) and the density increment (Fig. 3). The top and bottom panels show the WISE × PS1 and WISE × SCOS samples, respectively. The conventionally adopted significance threshold, p value = 0.05, is shown as the vertical red line. Right panels: same as the left panels, but for the Pearson coefficients derived from the Monte Carlo simulations.
Current usage metrics show cumulative count of Article Views (full-text article views including HTML views, PDF and ePub downloads, according to the available data) and Abstracts Views on Vision4Press platform.
Data correspond to usage on the plateform after 2015. The current usage metrics is available 48-96 hours after online publication and is updated daily on week days.
Initial download of the metrics may take a while.