Fig. 3.
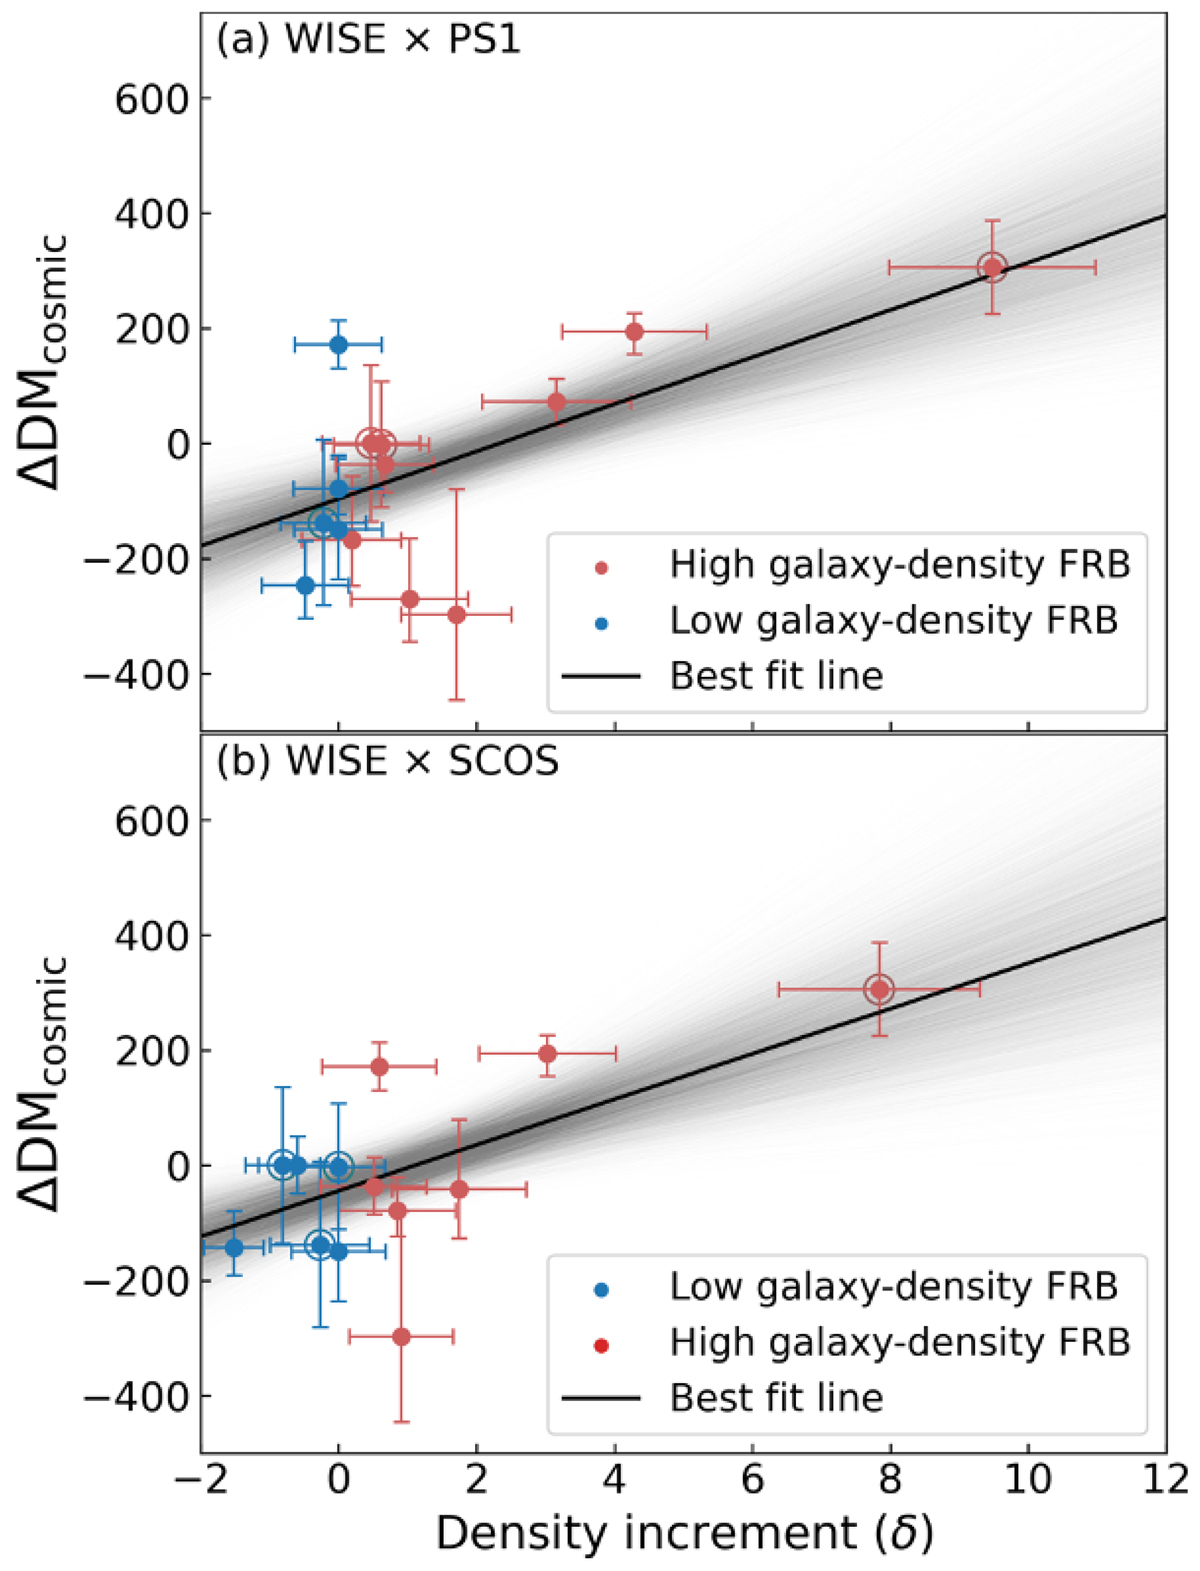
Download original image
Panels (a) and (b): deviation of DMcosmic (ΔDMcosmic) (pc cm−3) from the theoretical curve (solid black line in Fig. 2) as a function of the density increment with WISE × PS1 and SCOS × WISE FRB samples, respectively. The coloring of the data points is the same as Fig. 2. The thin gray lines indicate the individual best-fit linear functions to the data points, randomized with the uncertainties following the Gaussian probability density functions by the Monte Carlo simulations. The solid black line indicates the median of the best-fit linear functions.
Current usage metrics show cumulative count of Article Views (full-text article views including HTML views, PDF and ePub downloads, according to the available data) and Abstracts Views on Vision4Press platform.
Data correspond to usage on the plateform after 2015. The current usage metrics is available 48-96 hours after online publication and is updated daily on week days.
Initial download of the metrics may take a while.