Fig. 2.

Download original image
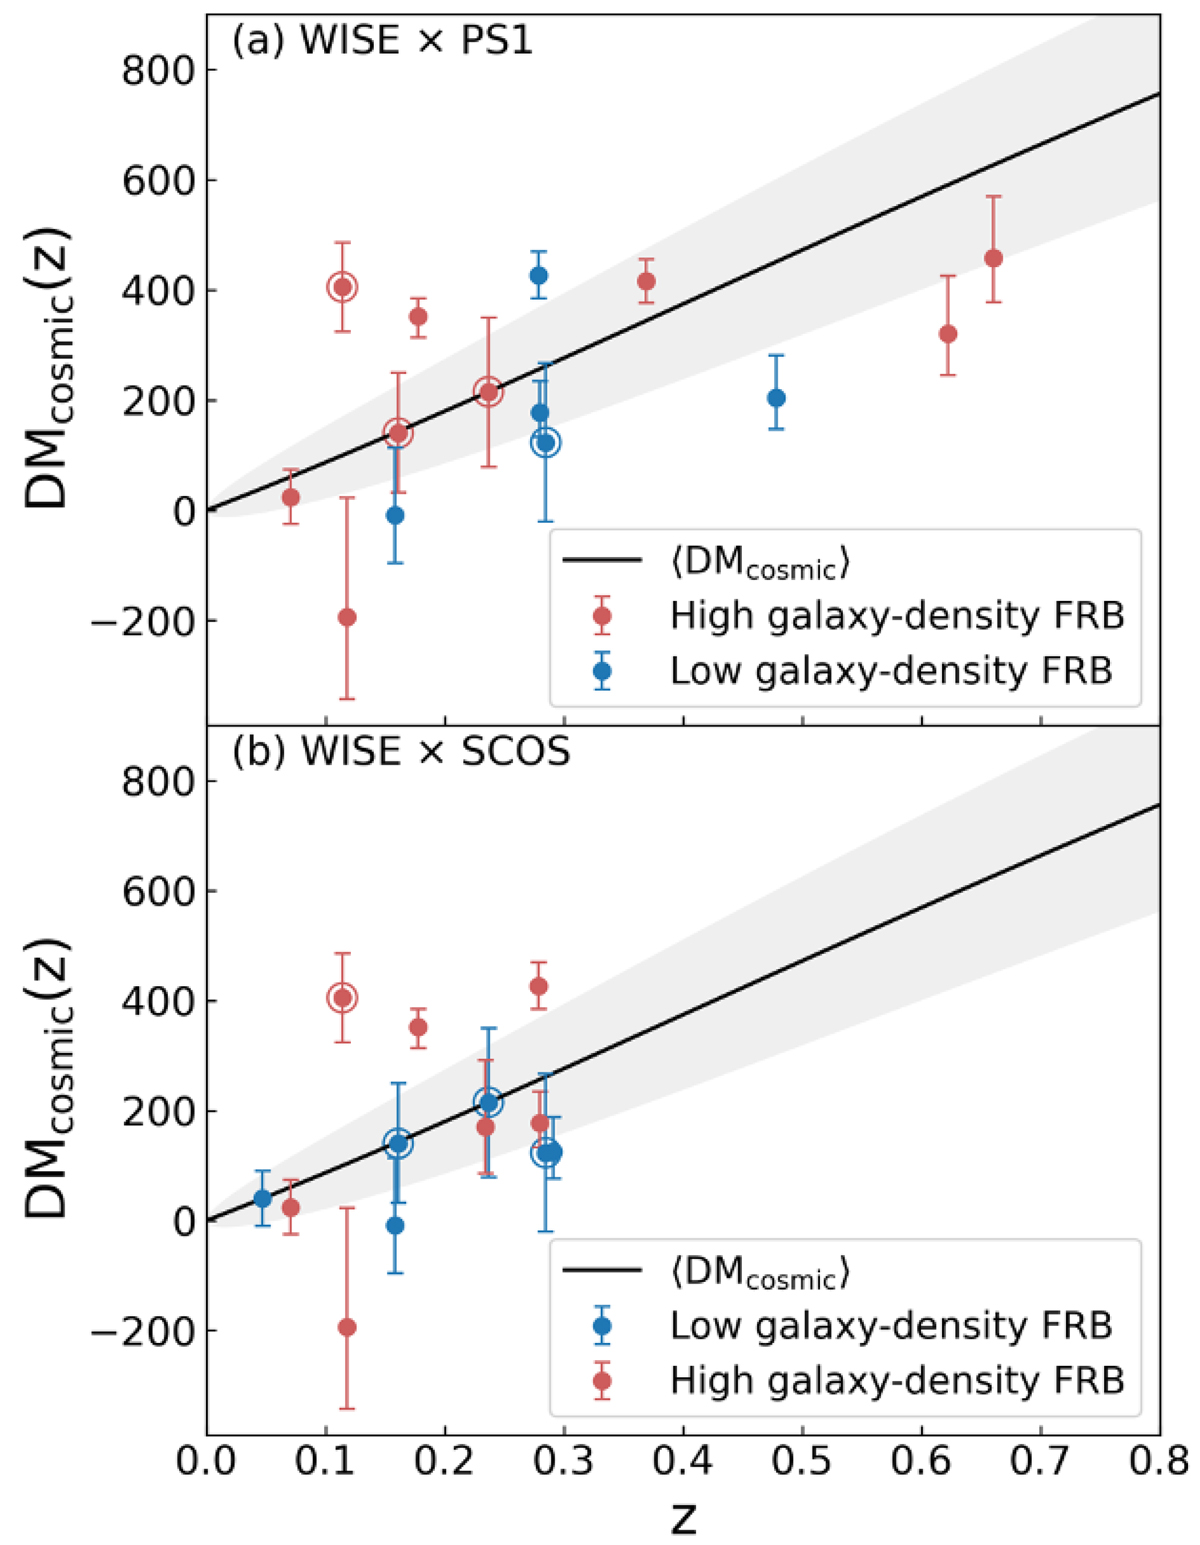
Panels (a) and (b): Macquart relation, i.e., DMcosmic (pc cm−3) as a function of redshift, with the WISE × PS1 and SCOS × WISE FRB samples, respectively. The high-density (δ>0) FRB samples are denoted as red data points, and the low-density (δ≤0) FRB samples are represented by blue data points (see Section 2.3 for the details of the galaxy number-density calculation). The FRB samples with upper limits on τ are marked with open circles on the data points. The solid black line shows the theoretical prediction of the average DMcosmic, 〈DMcosmic〉, as a function of z by adopting the Planck18 cosmology (Planck Collaboration VI 2020) and the fraction of the cosmic baryons in the diffuse gas, fd = 0.85. The gray shaded region shows the expected scatter of DMcosmic due to the cosmic variance (McQuinn 2013; Cordes et al. 2022).
Current usage metrics show cumulative count of Article Views (full-text article views including HTML views, PDF and ePub downloads, according to the available data) and Abstracts Views on Vision4Press platform.
Data correspond to usage on the plateform after 2015. The current usage metrics is available 48-96 hours after online publication and is updated daily on week days.
Initial download of the metrics may take a while.


