Fig. 1.
Download original image
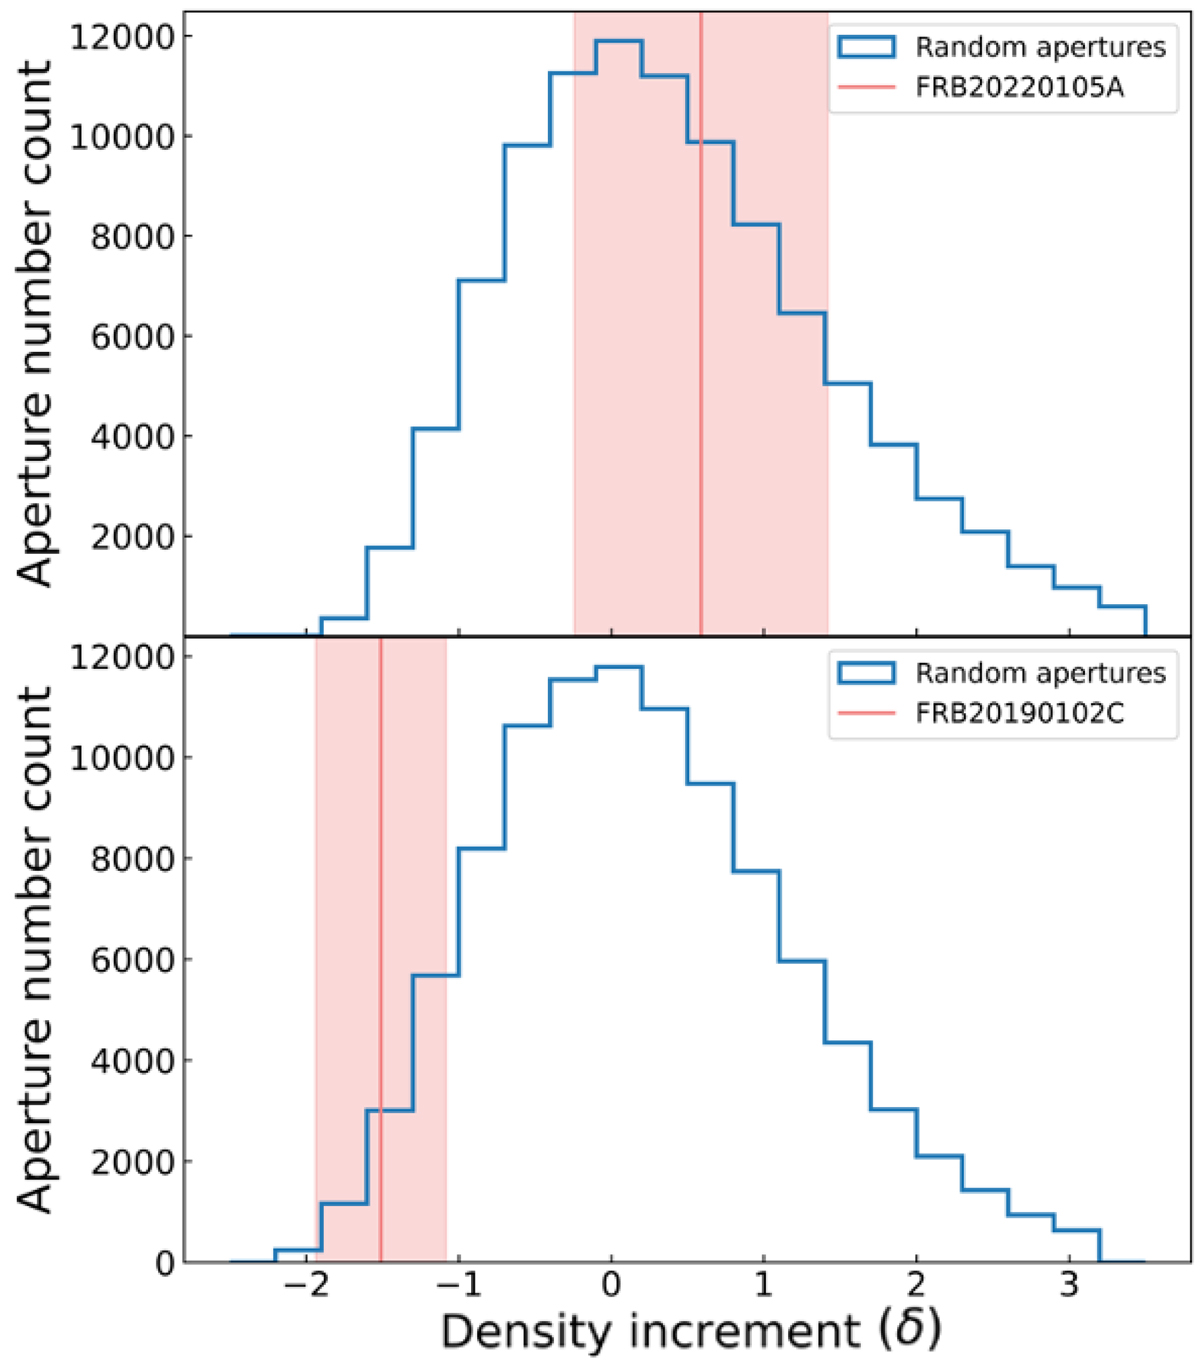
Example histograms of density increments of random apertures and FRB sight lines. Panels (a) and (b) show examples of FRBs in high and low galaxy-number-density environments, respectively, calculated by using WISE × SCOS samples. In each panel, the blue histogram demonstrates the density increment of random apertures, and the vertical red line shows the density increment of the FRB sight line. The ±1σ errors are shown by the red shaded region.
Current usage metrics show cumulative count of Article Views (full-text article views including HTML views, PDF and ePub downloads, according to the available data) and Abstracts Views on Vision4Press platform.
Data correspond to usage on the plateform after 2015. The current usage metrics is available 48-96 hours after online publication and is updated daily on week days.
Initial download of the metrics may take a while.