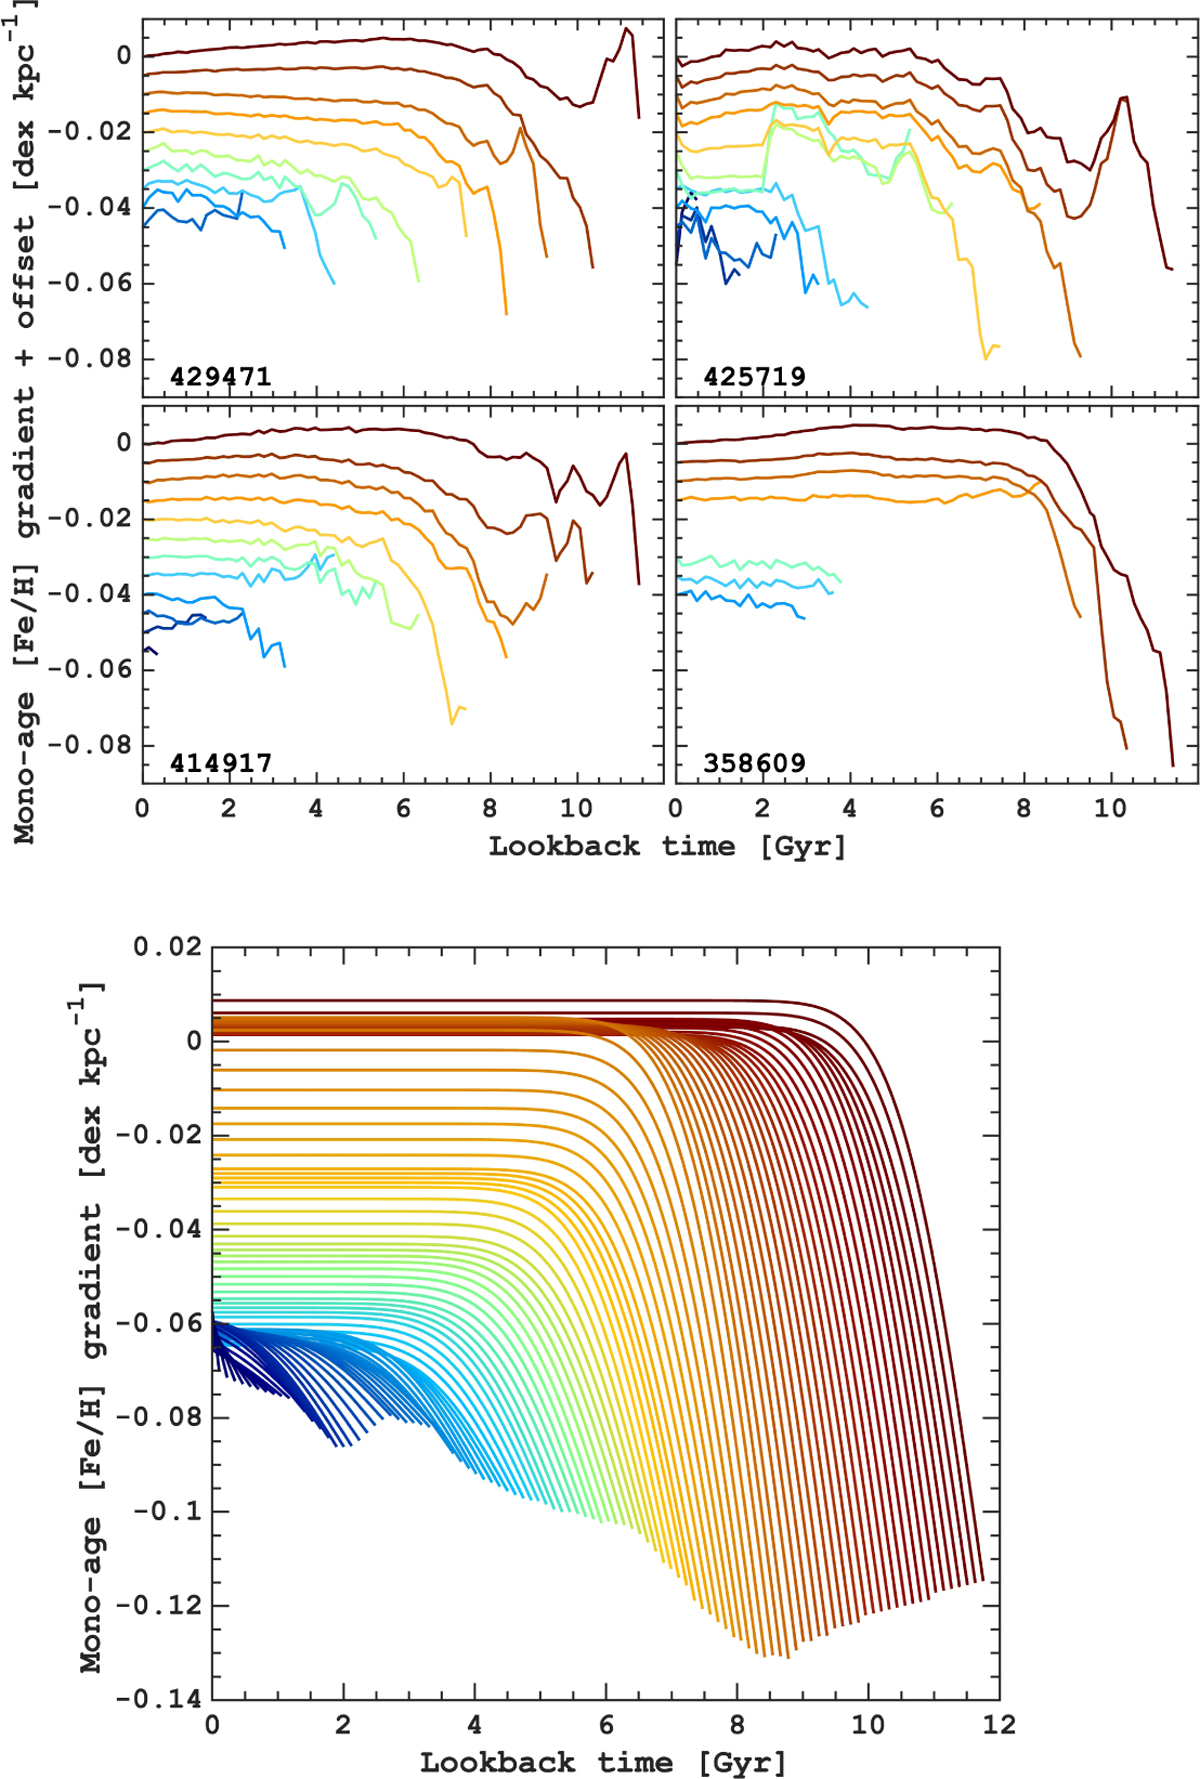
Fig. C.5
Download original image
Four top panels: Evolution of the radial metallicity gradient for mono-age stellar populations in four barred TNG50 galaxies. Bottom panel: Assumed evolution of the mono-abundance metallicity gradients in the MW. In all plots, the lines of different colors correspond to populations of different ages, where red represents older populations, and blue shows the evolution of younger populations. In the right panel, the initial and present day gradient values are obtained in this work and presented in Fig. 5. The mono-age metallicity gradient evolution model is described in Section. 5.2 with the timescale parameter α = 1 Gyr.
Current usage metrics show cumulative count of Article Views (full-text article views including HTML views, PDF and ePub downloads, according to the available data) and Abstracts Views on Vision4Press platform.
Data correspond to usage on the plateform after 2015. The current usage metrics is available 48-96 hours after online publication and is updated daily on week days.
Initial download of the metrics may take a while.