Fig. C.2
Download original image
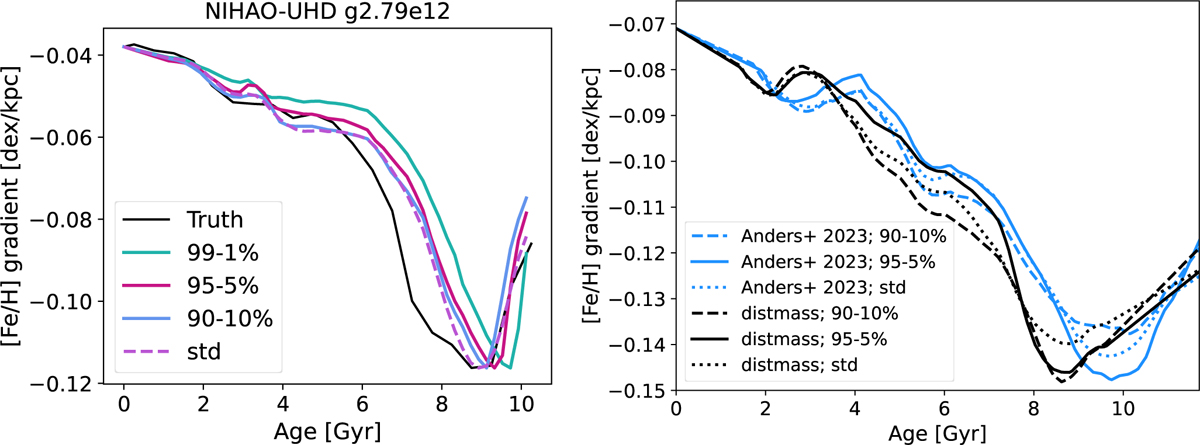
Illustration of different ways to calculate the scatter in [Fe/H] when recovering the metallicity gradient in NIHAO-UHD galaxy g2.79e12 (left panel). The shape is consistent when using different percentiles to calculate the range in [Fe/H], and also consistent when using the standard deviation even when the [Fe/H] distribution is skewed at a given age. Using the 99-1 percentiles yields the worst results, as it includes too many outliers, while the other methods focus on the main star forming region. The right panel provides the MW gradient recovered using different percentiles for calculating the scatter in [Fe/H] across age bins. Each method shows multiple fluctuations in the gradient, and a birth metallicity gradient weakening with time. Figure 5 uses the standard deviation.
Current usage metrics show cumulative count of Article Views (full-text article views including HTML views, PDF and ePub downloads, according to the available data) and Abstracts Views on Vision4Press platform.
Data correspond to usage on the plateform after 2015. The current usage metrics is available 48-96 hours after online publication and is updated daily on week days.
Initial download of the metrics may take a while.