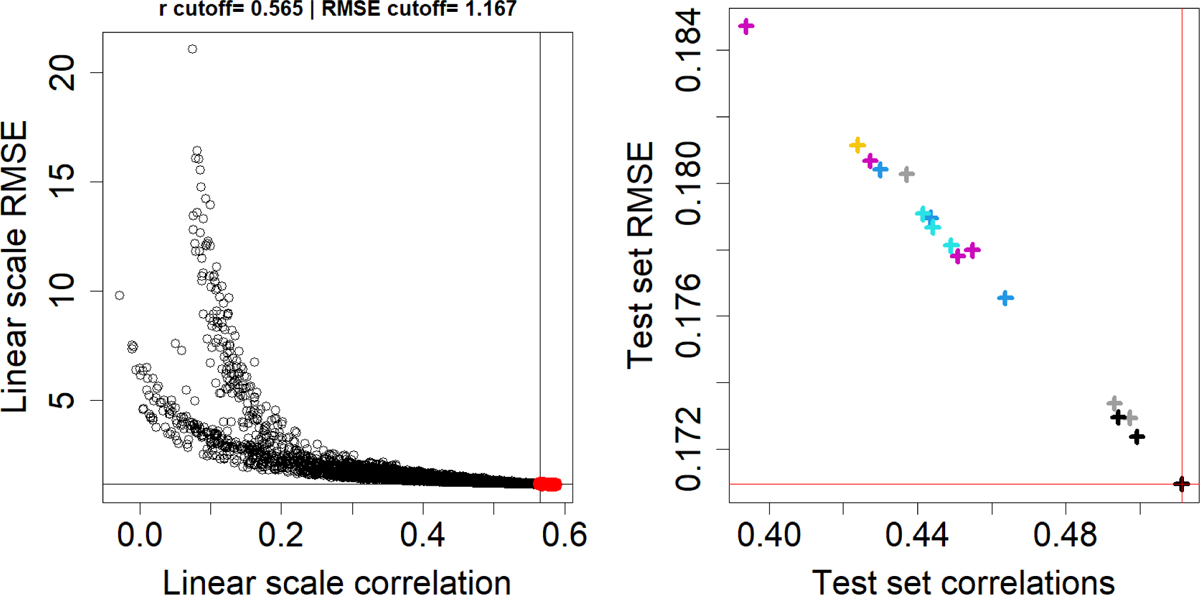
Fig. 6
Download original image
Left panel: plot showing the RMSE and correlation scores for 16 510 formulas. The red points show the formulas selected for analysis on the test set. These formulas achieve correlation and RMSE scores above the cutoffs mentioned at the top of the figure. Right panel: performance of the selected subset of formulas on the test set. Each plus symbol here represents one formula selected from the left panel (red points). The red vertical and horizontal lines point to the formula that obtained the lowest RMSE and highest correlation on the test set.
Current usage metrics show cumulative count of Article Views (full-text article views including HTML views, PDF and ePub downloads, according to the available data) and Abstracts Views on Vision4Press platform.
Data correspond to usage on the plateform after 2015. The current usage metrics is available 48-96 hours after online publication and is updated daily on week days.
Initial download of the metrics may take a while.