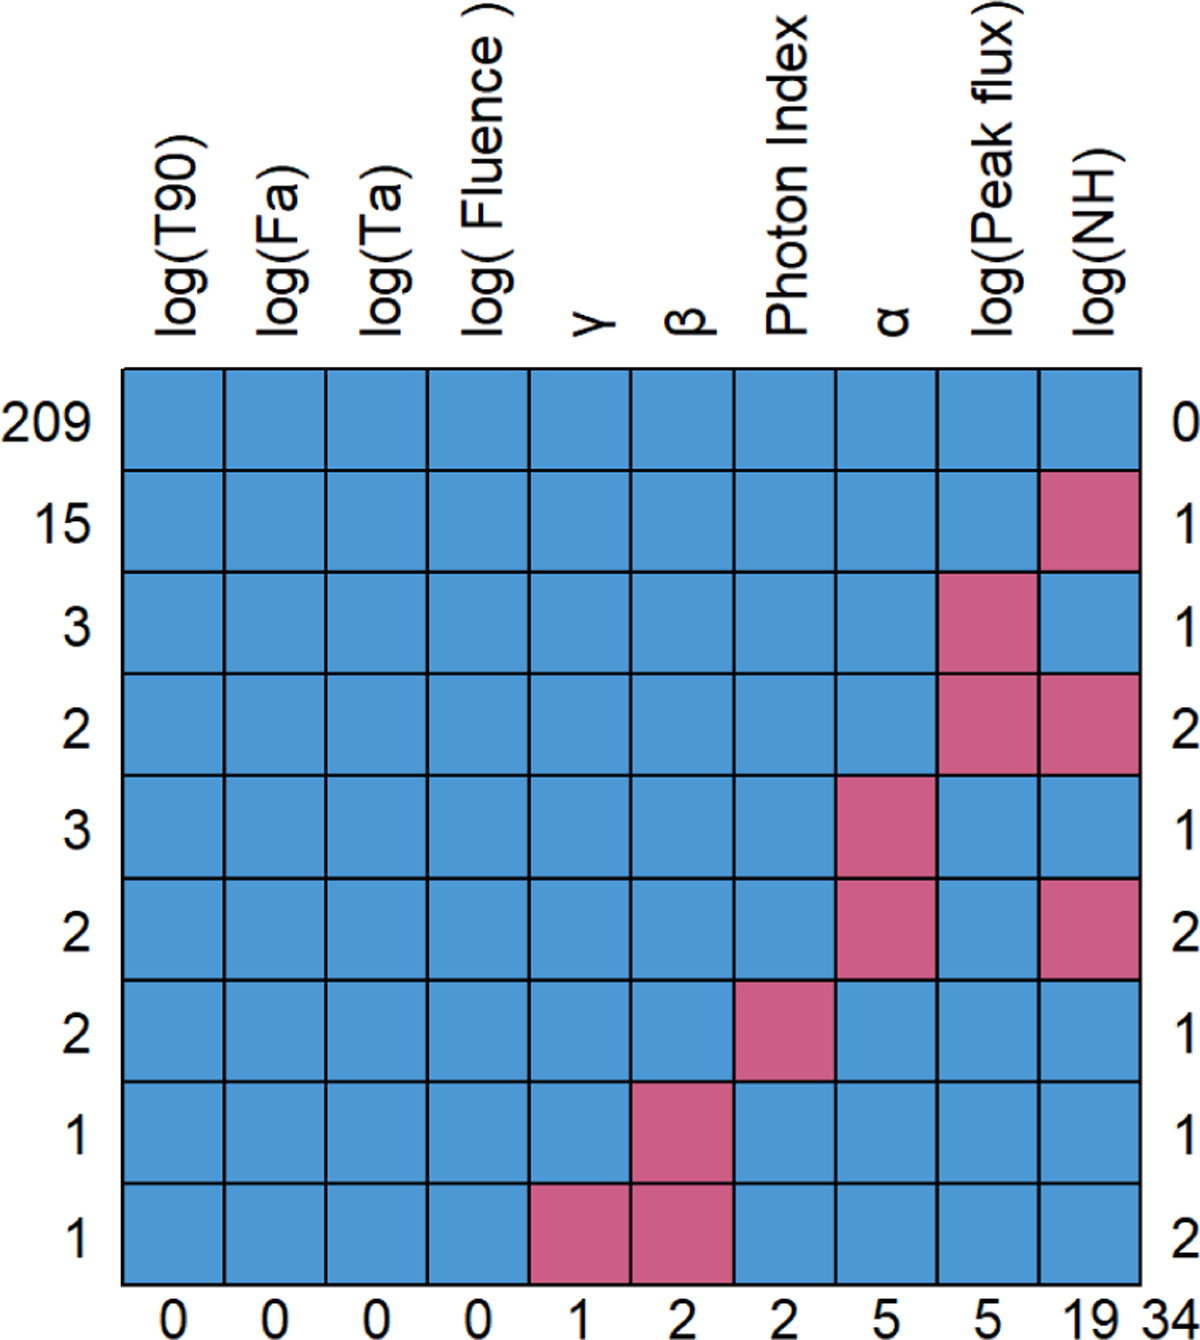
Fig. 4
Download original image
Distribution of missing data in our data set. The figure is divided into rows and columns. The top axis of the columns corresponds to the features in the data set, and the bottom axis corresponds to the total number of missing entries in that specific feature. Thus, for log(NH) there are 19 missing entries, for log(Peakflux) there are five missing entries, and so on. The left axis corresponds to the number of GRBs, and the right axis corresponds to the number of features with missing entries. The blue squares show the complete entries, and the red squares show which features are missing for a given number of GRBs. Thus, the first row indicates that there are 209 GRBs with no missing features, and the second row indicates that there are 15 GRBs with missing entries in only one feature, which is log(NH). The third row indicates that there are three GRBs with missing entries in one feature, which is log(Peakflux), and the fourth row indicates that there are two GRBs with missing entries in two features simultaneously, which are log(Peakflux) and log(NH).
Current usage metrics show cumulative count of Article Views (full-text article views including HTML views, PDF and ePub downloads, according to the available data) and Abstracts Views on Vision4Press platform.
Data correspond to usage on the plateform after 2015. The current usage metrics is available 48-96 hours after online publication and is updated daily on week days.
Initial download of the metrics may take a while.