Open Access
Fig. 3
Download original image
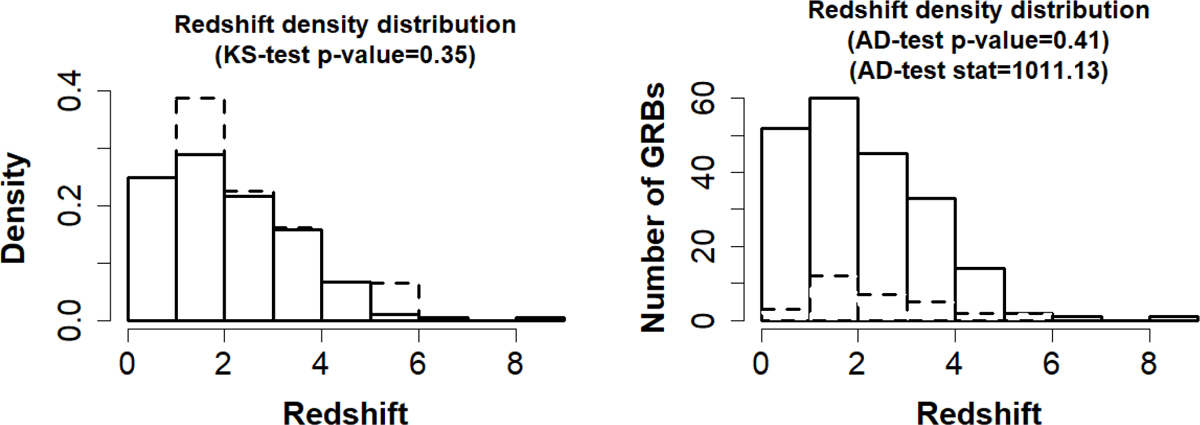
Left panel: redshift distribution of the new sample (dashed lines) and the old sample (solid line) normalized to one. Right panel: distribution of the new and the old samples when not normalized.
Current usage metrics show cumulative count of Article Views (full-text article views including HTML views, PDF and ePub downloads, according to the available data) and Abstracts Views on Vision4Press platform.
Data correspond to usage on the plateform after 2015. The current usage metrics is available 48-96 hours after online publication and is updated daily on week days.
Initial download of the metrics may take a while.