Fig. 2
Download original image
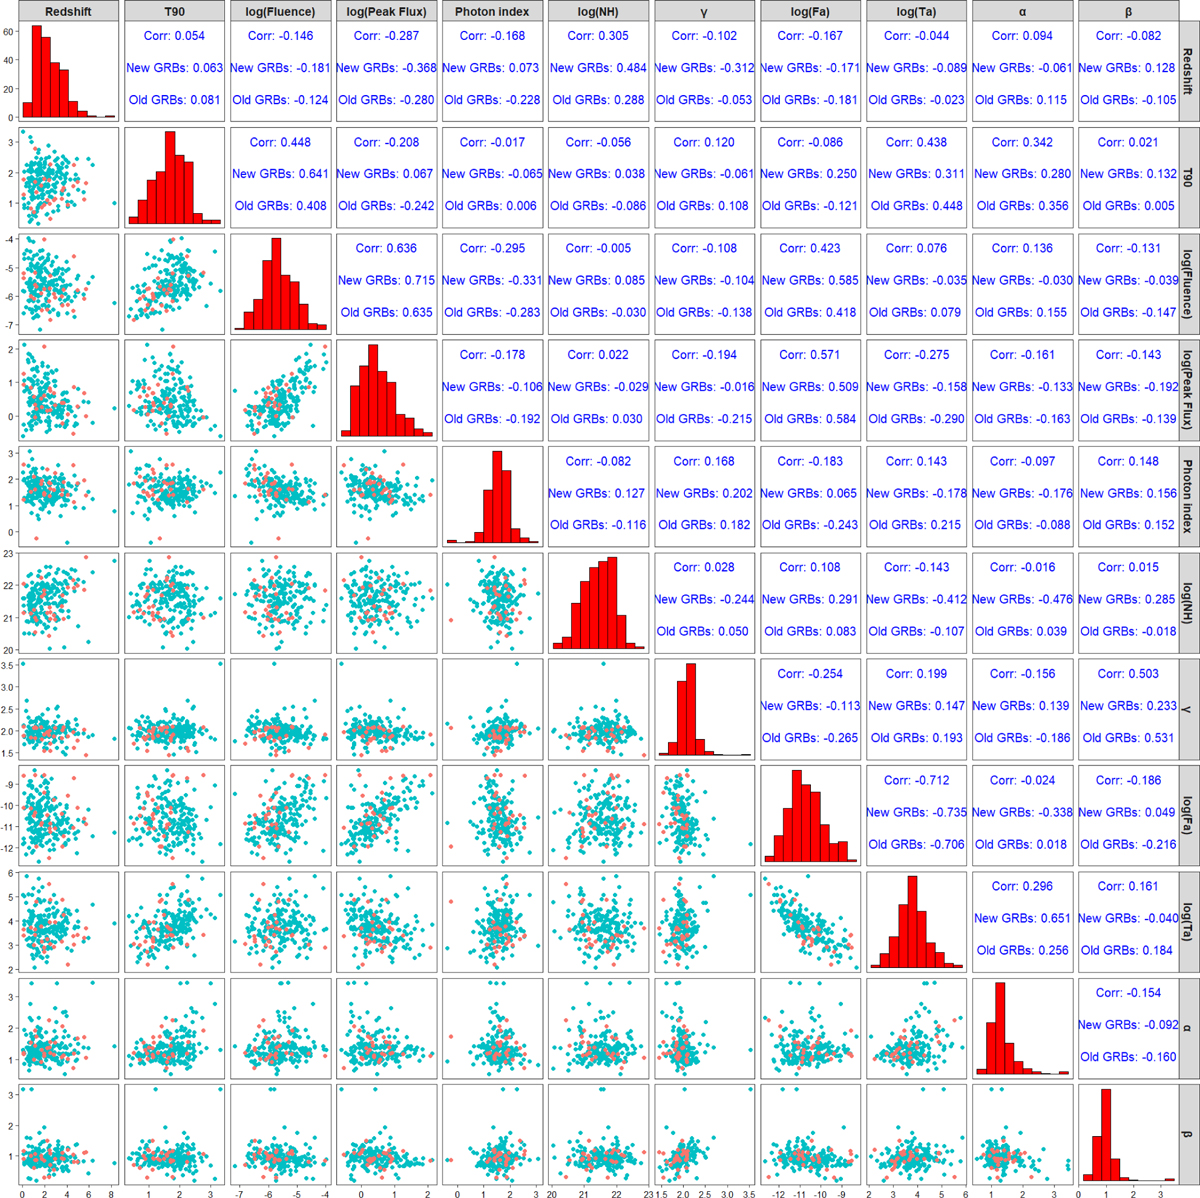
Scatter matrix plot showing the distribution of the features involved, with the diagonal showing the distributions. The 30 GRBs added to the training set are shown as orange dots, while those of the previous sample from Dainotti et al. (2024c) are represented by cyan dots. The numbers in the upper triangle show the correlation between two respective features measured for new GRBs, the previous sample, and the combined sample.
Current usage metrics show cumulative count of Article Views (full-text article views including HTML views, PDF and ePub downloads, according to the available data) and Abstracts Views on Vision4Press platform.
Data correspond to usage on the plateform after 2015. The current usage metrics is available 48-96 hours after online publication and is updated daily on week days.
Initial download of the metrics may take a while.