Fig. 16
Download original image
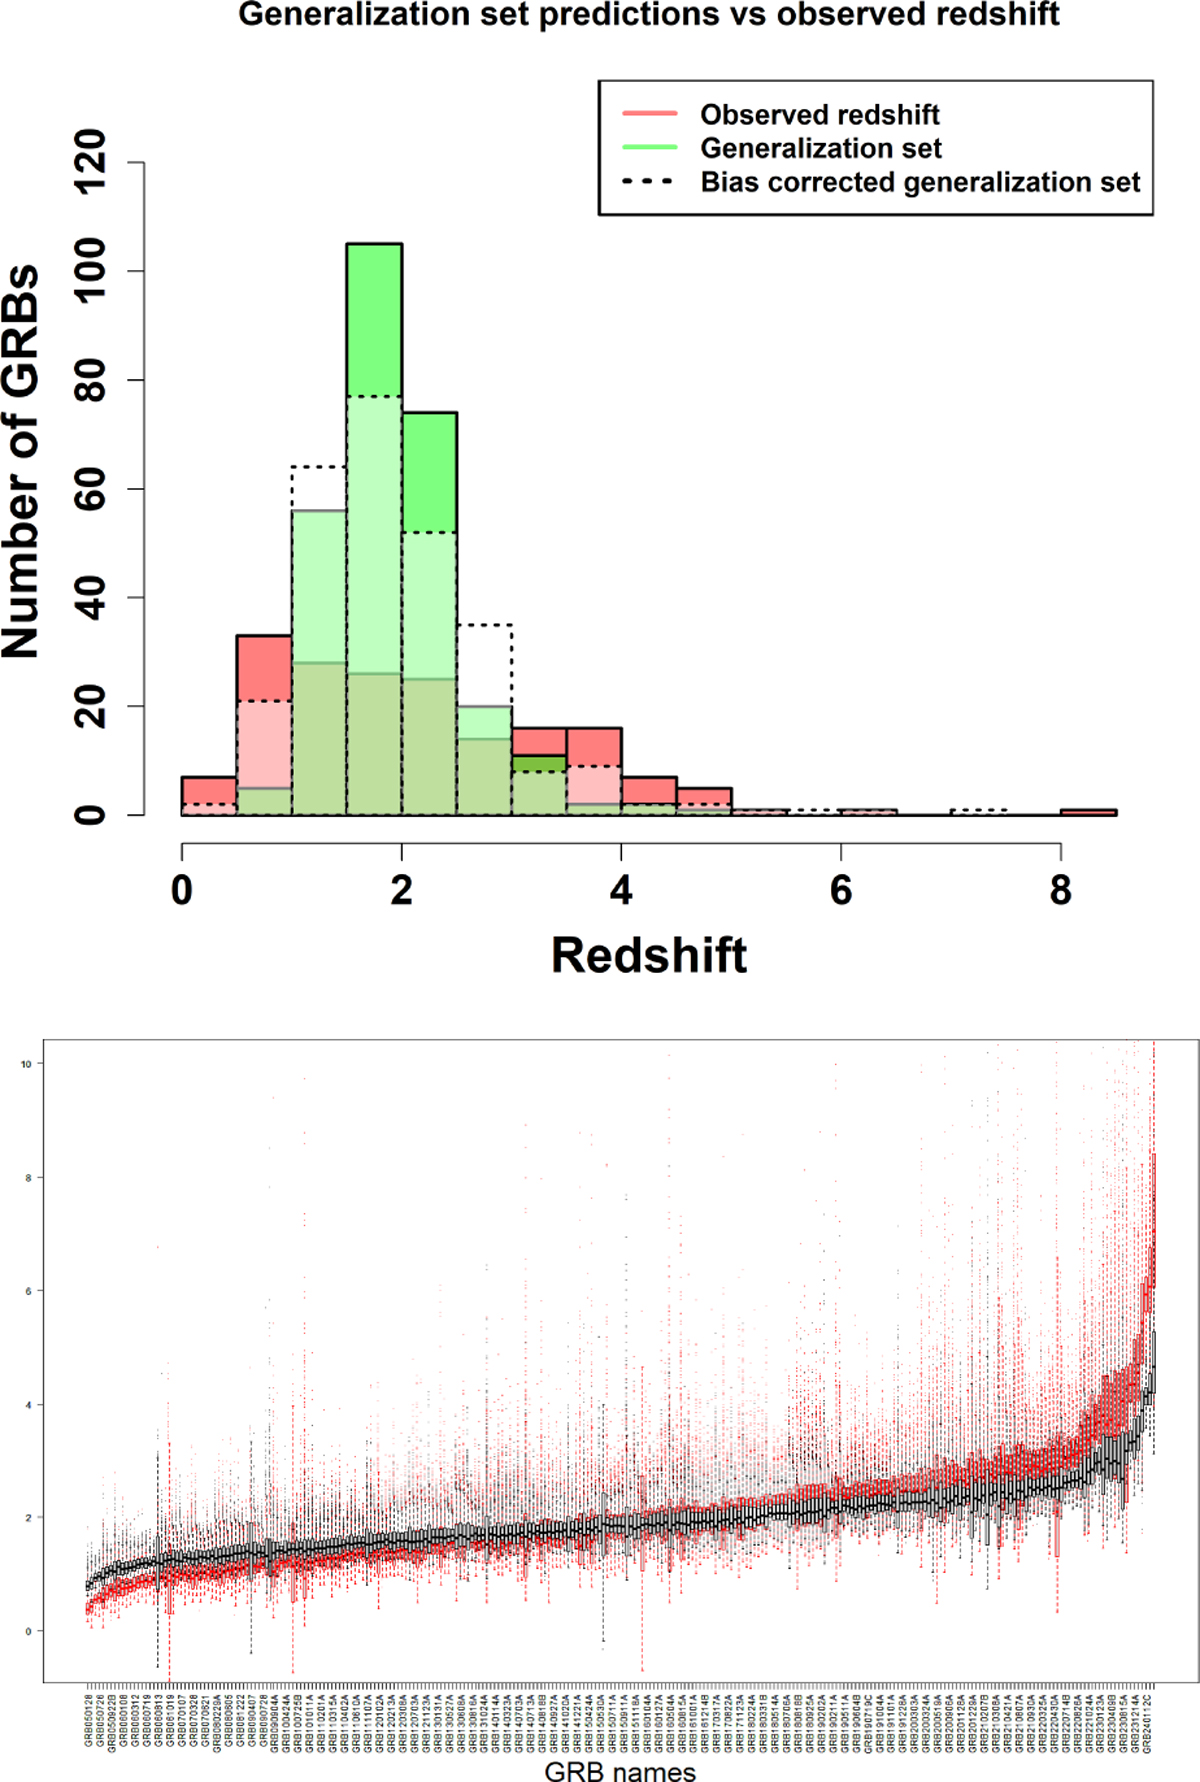
Upper panel: redshift distribution of the generalization and training sets. The training set is shown with red histograms, while the generalization set with and without bias correction is shown in white and green histograms, respectively. Lower panel: box plot distribution of the generalization set redshift predictions, sorted from lowest to highest redshift. The bias-corrected and non-bias-corrected distributions are shown in red and gray box plots, respectively. The dots show the outlier predictions obtained.
Current usage metrics show cumulative count of Article Views (full-text article views including HTML views, PDF and ePub downloads, according to the available data) and Abstracts Views on Vision4Press platform.
Data correspond to usage on the plateform after 2015. The current usage metrics is available 48-96 hours after online publication and is updated daily on week days.
Initial download of the metrics may take a while.