Fig. 15
Download original image
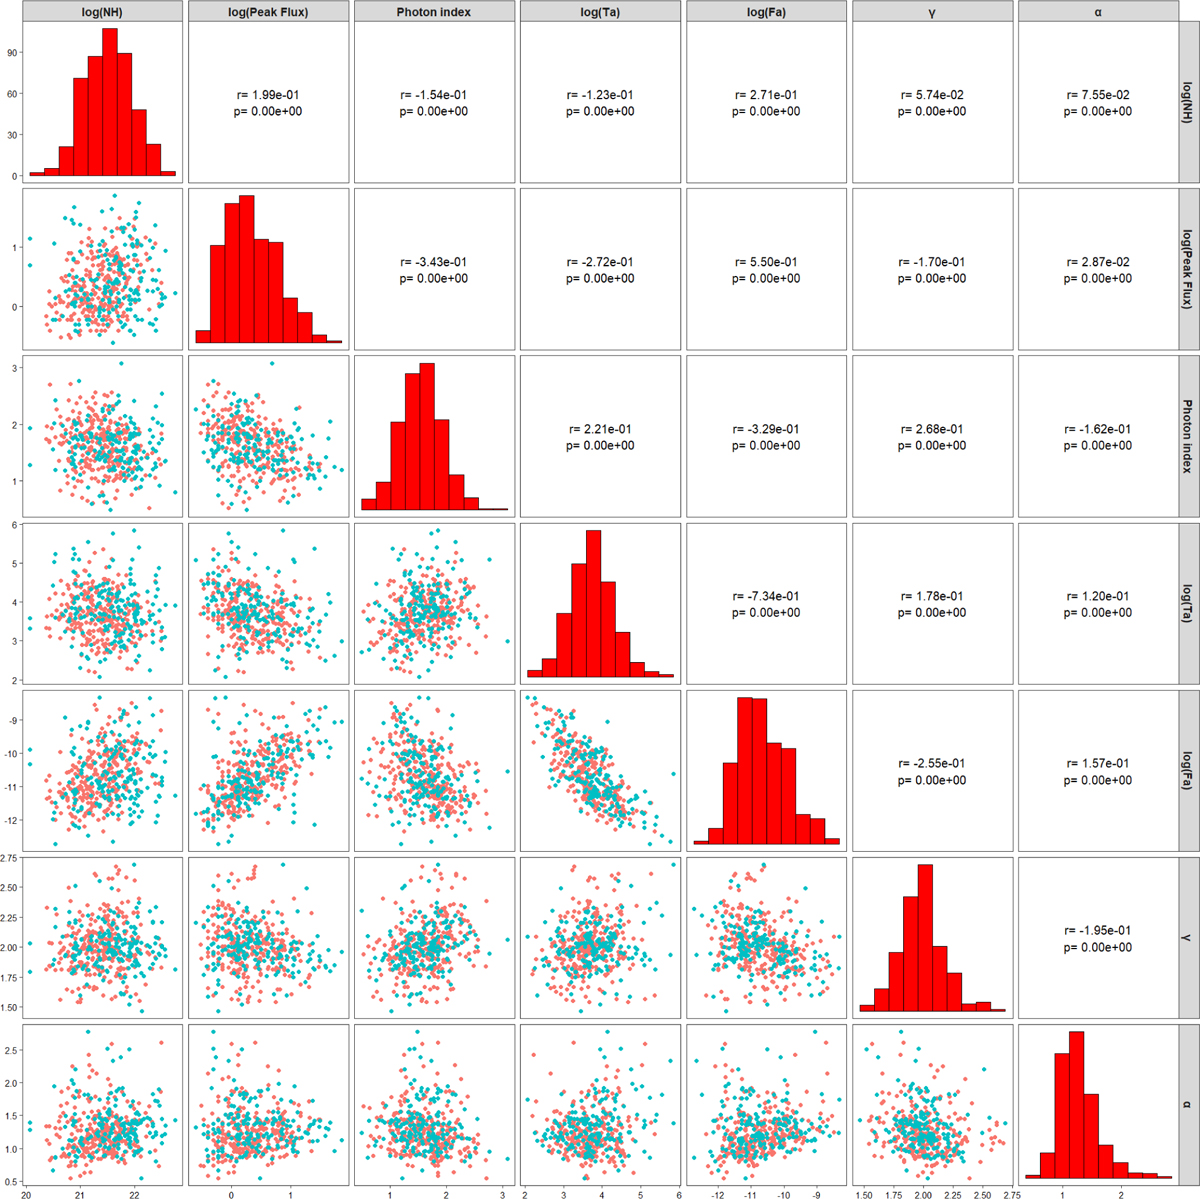
Scatter matrix plot of the generalization and training sets. The generalization set is presented with orange dots, and the training set is presented with cyan dots. The diagonal shows the histogram distribution for the generalization set, while the upper triangle shows the Pearson correlation values for respective pairs of parameters.
Current usage metrics show cumulative count of Article Views (full-text article views including HTML views, PDF and ePub downloads, according to the available data) and Abstracts Views on Vision4Press platform.
Data correspond to usage on the plateform after 2015. The current usage metrics is available 48-96 hours after online publication and is updated daily on week days.
Initial download of the metrics may take a while.