Fig. 9.
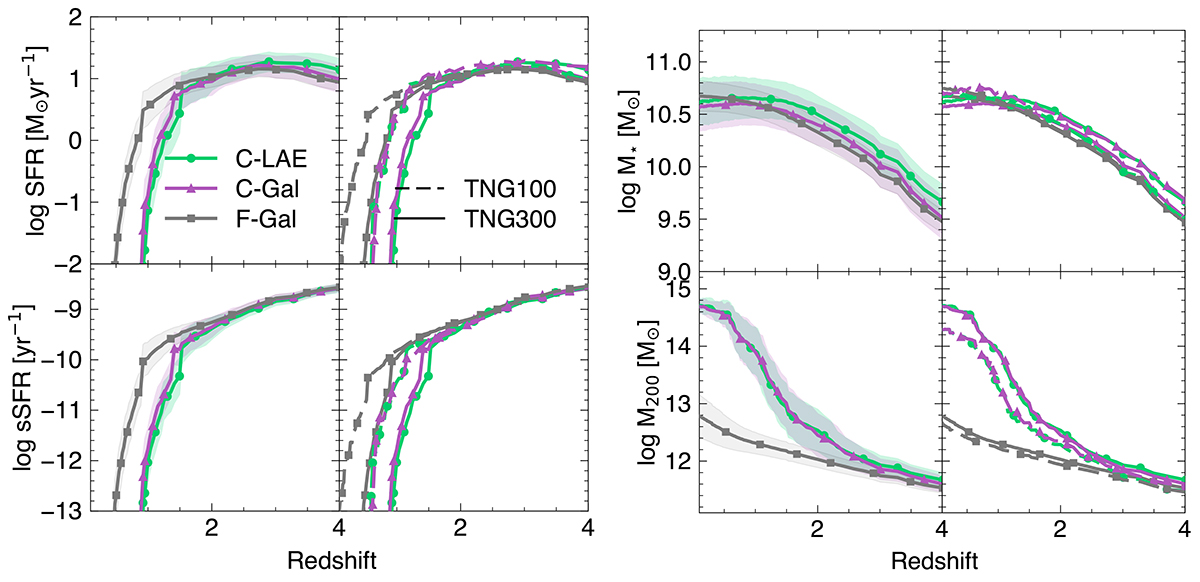
Download original image
Cosmic evolution of SFR, M★, sSFR, and M200 for the C-LAE (green lines with circles), F-Gal (gray lines with squares), and C-Gal (purple lines with triangles) samples between z = 0−4 for TNG300 (solid lines) and TNG100 (dashed lines) simulations. Each line represents the mean of the galaxy dataset. The left panels of each block (first and third columns) show the results for only the TNG300 simulation, including errors calculated as the standard deviation. For the SFR and sSFR, the galaxies that have star formation equal to zero are included in the median calculation, but not the standard deviation (see the text for further details). The right panels of each block (second and fourth columns) present a comparison between the results obtained for TNG100 and TNG300.
Current usage metrics show cumulative count of Article Views (full-text article views including HTML views, PDF and ePub downloads, according to the available data) and Abstracts Views on Vision4Press platform.
Data correspond to usage on the plateform after 2015. The current usage metrics is available 48-96 hours after online publication and is updated daily on week days.
Initial download of the metrics may take a while.