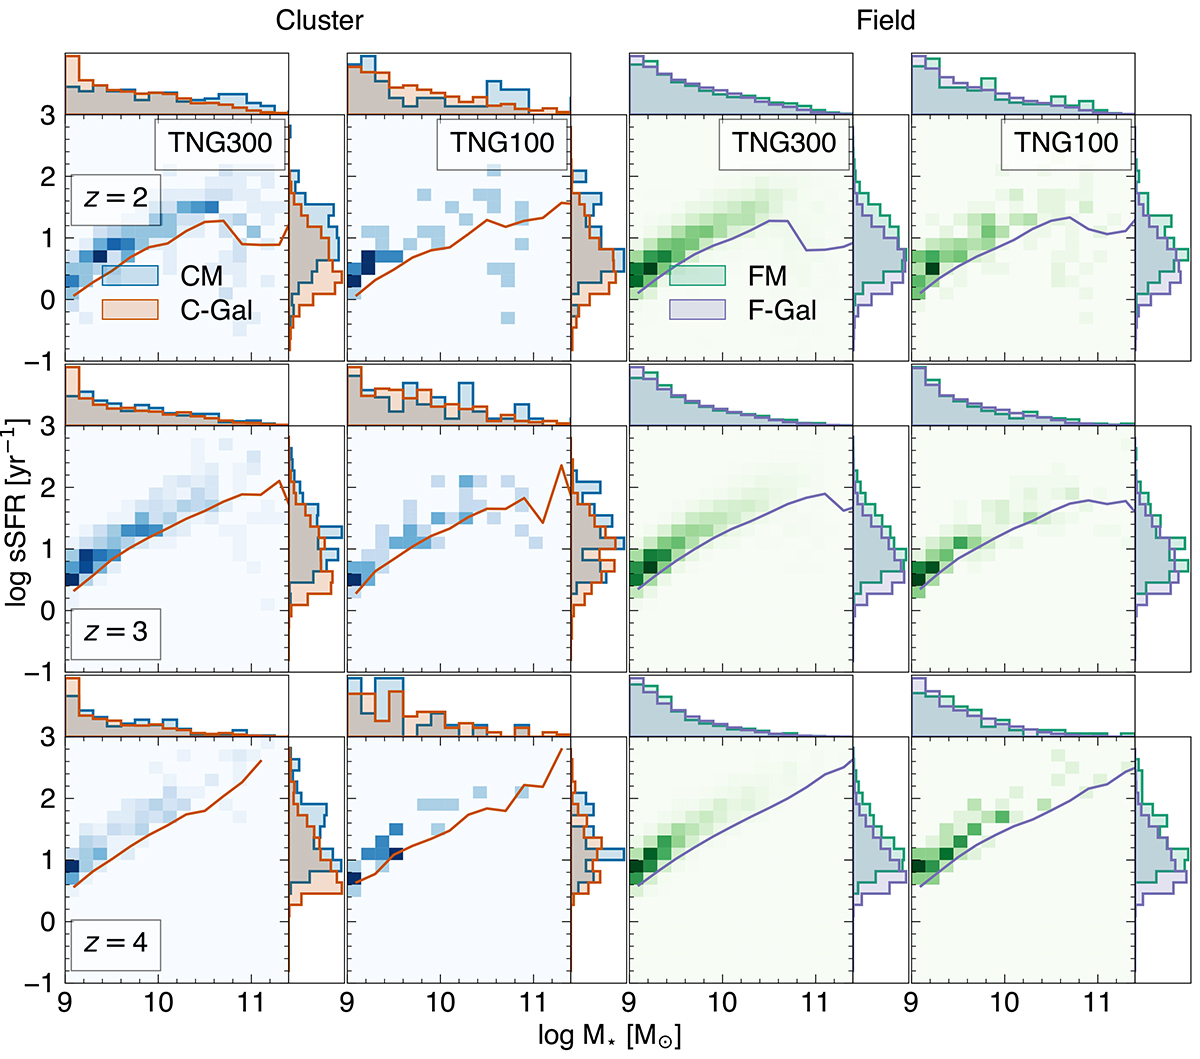
Fig. 8.
Download original image
Main panels: SFR vs. M★ for galaxies that experienced a major merger in the last ∼200 Myr at the time of observations at z = 2, 3, and 4. First and second columns present the distribution for CM (blue shades) and C-Gal (orange lines) for TNG300 and TNG100, respectively. The third and fourth columns display the distribution for FM (green shades) and F-Gal (light violet lines) for TNG300 and TNG100, respectively. Top and right side panels: Marginalized histograms for the stellar mass and SFR of the different galaxy samples at z = 2,3, and 4 for TNG300 and TNG100. The overall distributions of SFR and M★ for the CM and FM galaxies are markedly different from those of C-Gal and F-Gal. In particular, CM galaxies show a significant excess on the high-mass end in their mass distribution with respect to the C-Gal population. Furthermore, among the CM, FM, C-Gal and F-Gal groups, we find that the median SFR and M★ values are the highest for CM galaxies.
Current usage metrics show cumulative count of Article Views (full-text article views including HTML views, PDF and ePub downloads, according to the available data) and Abstracts Views on Vision4Press platform.
Data correspond to usage on the plateform after 2015. The current usage metrics is available 48-96 hours after online publication and is updated daily on week days.
Initial download of the metrics may take a while.