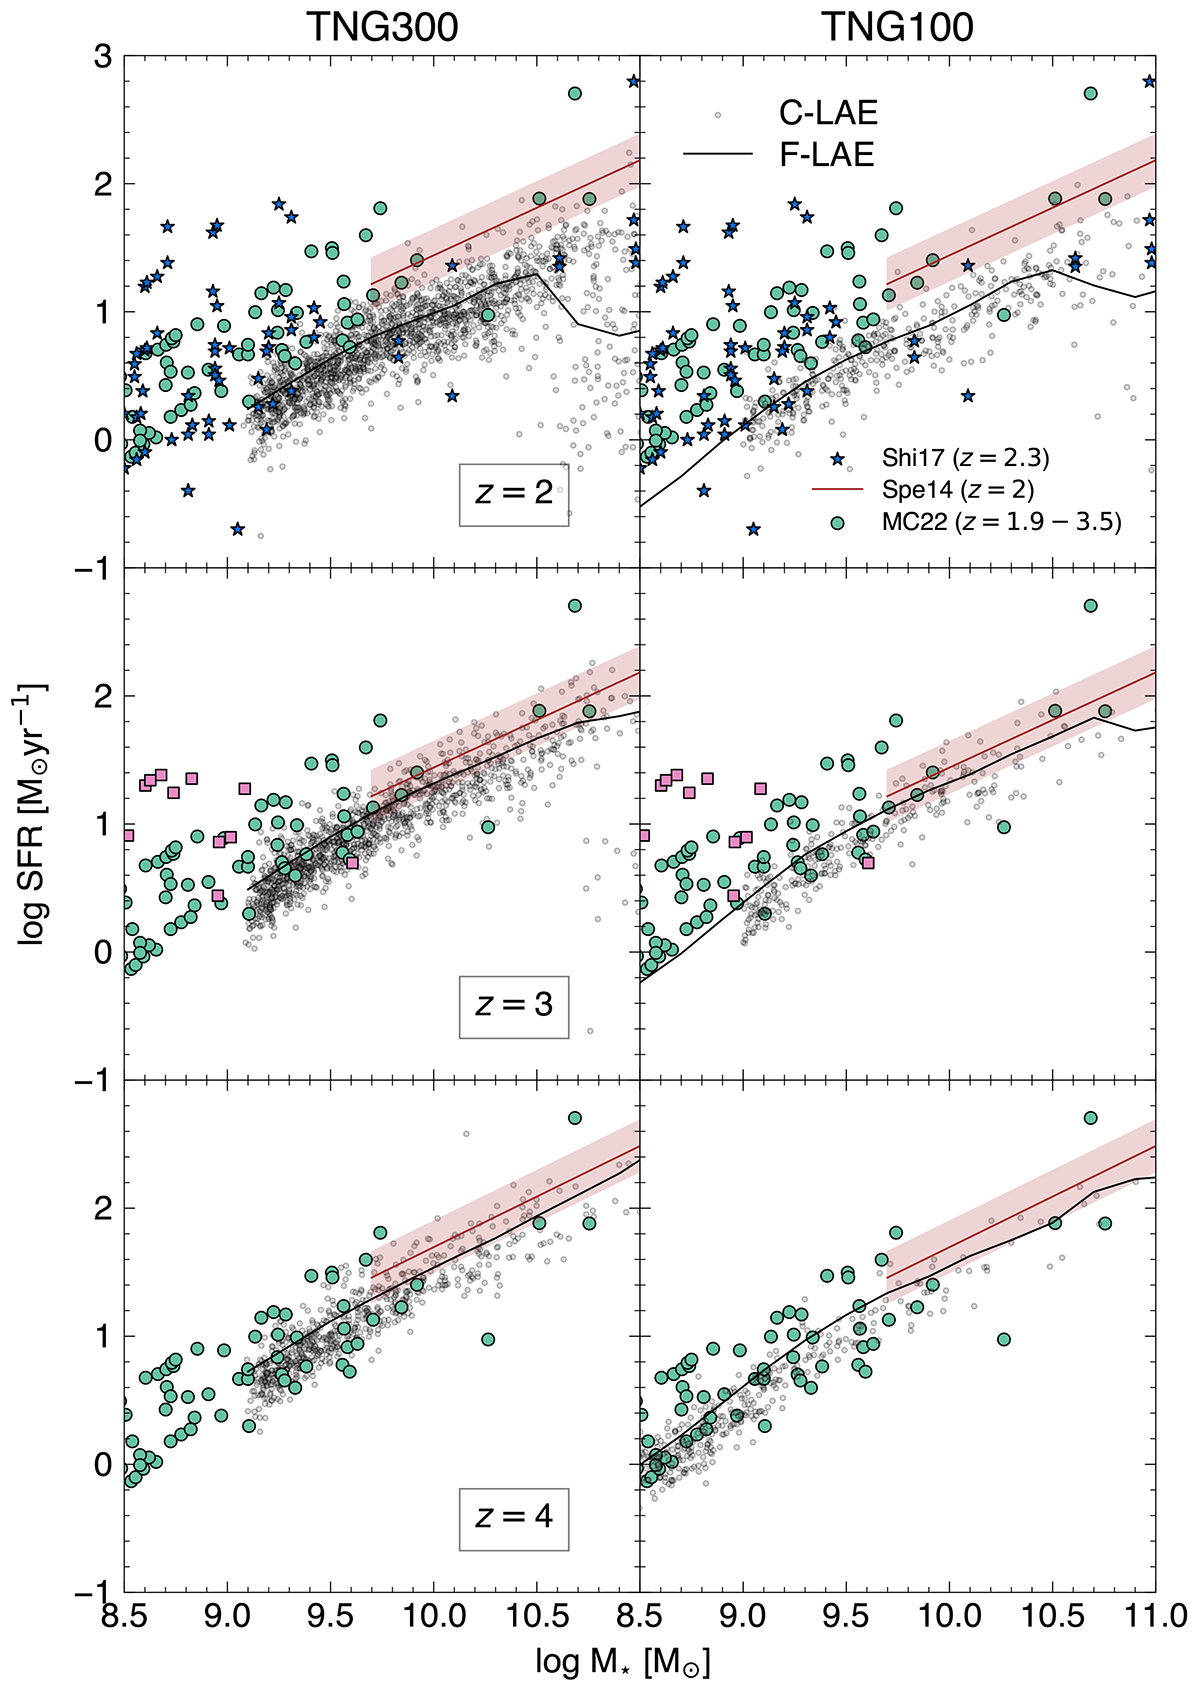
Fig. 6.
Download original image
SFR vs. M★ for TNG300 (left panels) and TNG100 (right) at z = 2,3, and 4 (from top to bottom) are shown. The black line illustrates the median scaling law for F-LAEs while the small gray dots show the C-LAEs. Existing measurements from Shimakawa et al. (2017, z = 2.3: blue stars), McCarron et al. (2022, z = 1.9−3.5: green circles), and Pucha et al. (2022, z = 2.65: pink squares) are in the appropriate redshift panels. The corresponding star-forming main sequence and its 1σ scatter from Speagle et al. (2014) are indicated by salmon lines and swaths.
Current usage metrics show cumulative count of Article Views (full-text article views including HTML views, PDF and ePub downloads, according to the available data) and Abstracts Views on Vision4Press platform.
Data correspond to usage on the plateform after 2015. The current usage metrics is available 48-96 hours after online publication and is updated daily on week days.
Initial download of the metrics may take a while.