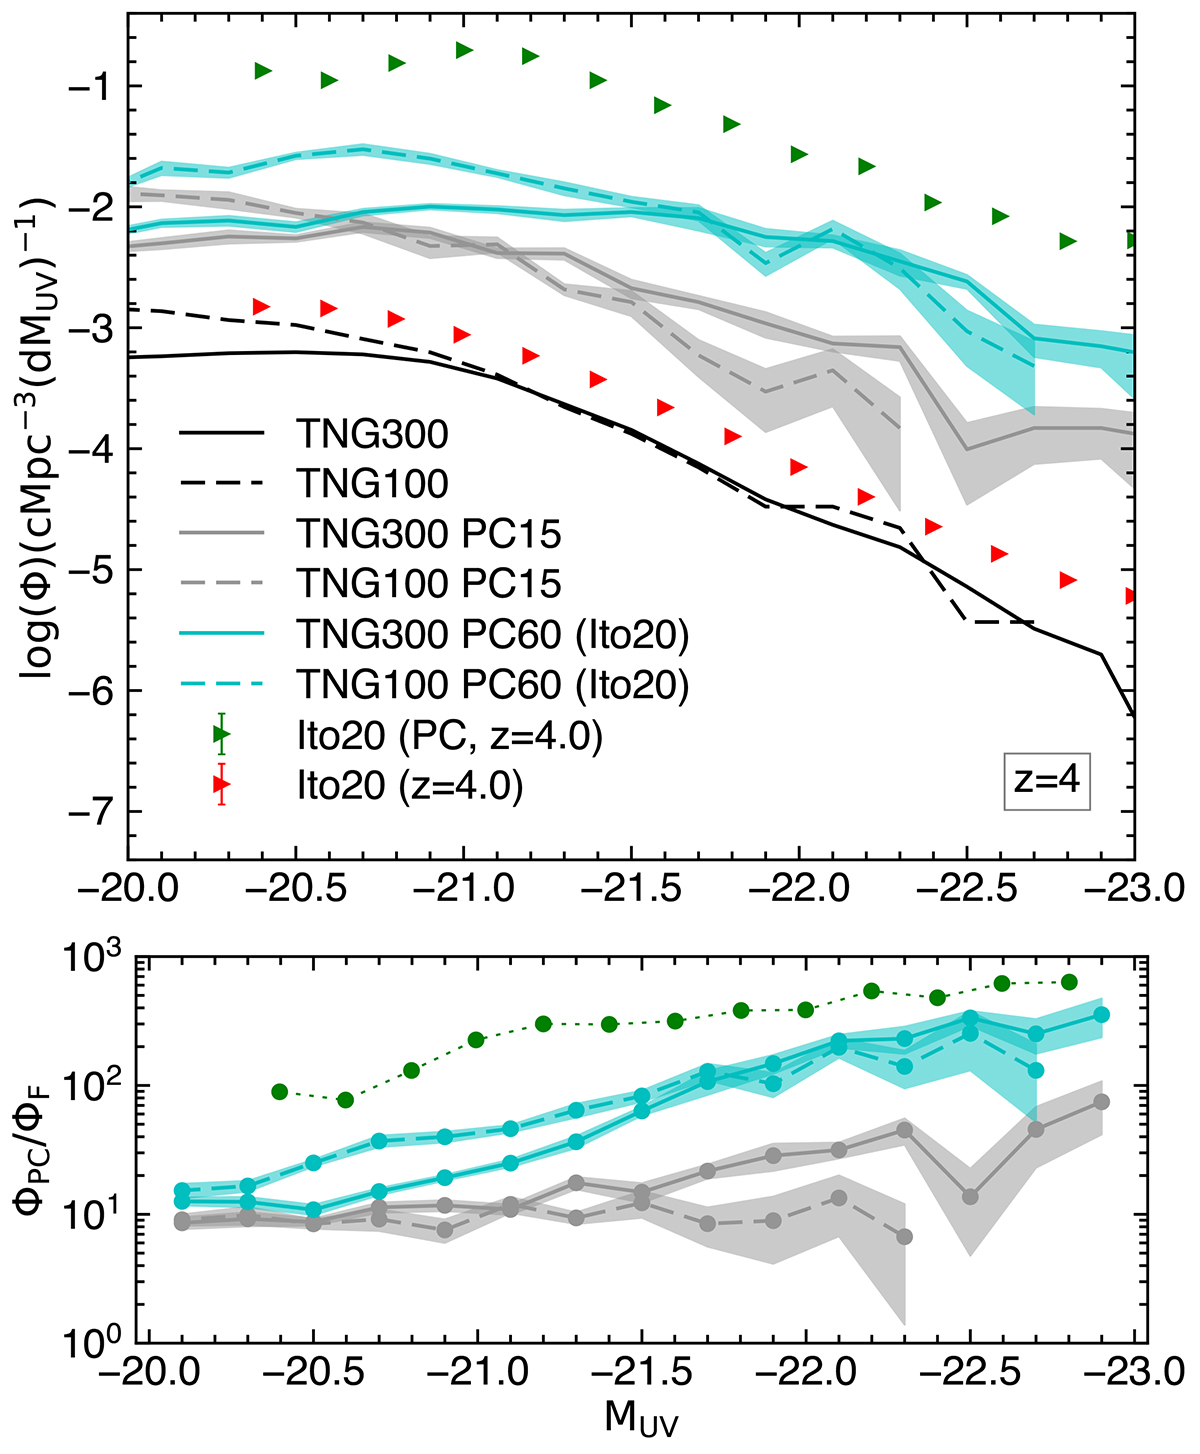
Fig. 4.
Download original image
Top: UVLFs of galaxies at z = 4 in the field (black) and protocluster (gray) volumes. The observational measures from GOLDRUSH (Ito et al. 2020) are shown as green and red triangles. The revised measurements when protoclusters are selected similar to their approach are shown in cyan lines and shades. In protocluster environment, the overall number density is much greater. Bottom: the ratio of the protocluster-to-field UVLF indicates the excess of UV-bright galaxies. The trend is even more pronounced when protoclusters are defined as regions of enhanced surface density in smaller areas (corresponding to a cylindrical volume of 7.5 cMpc in diameter and depth).
Current usage metrics show cumulative count of Article Views (full-text article views including HTML views, PDF and ePub downloads, according to the available data) and Abstracts Views on Vision4Press platform.
Data correspond to usage on the plateform after 2015. The current usage metrics is available 48-96 hours after online publication and is updated daily on week days.
Initial download of the metrics may take a while.