Fig. 2.
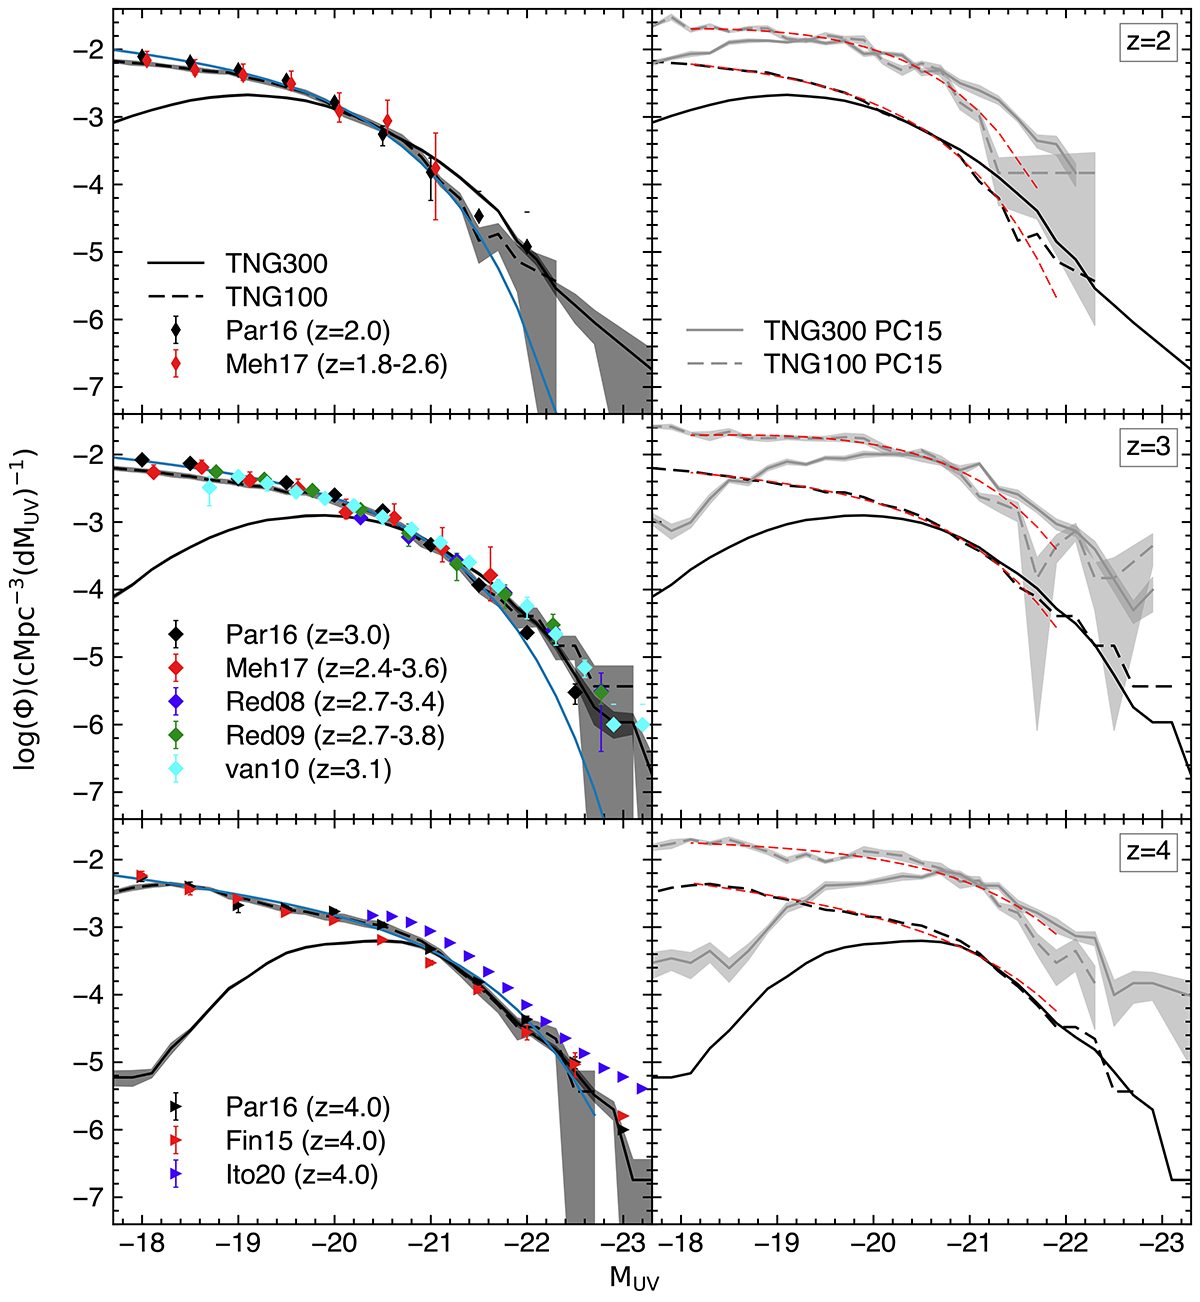
Download original image
Left: Rest-frame UV luminosity functions at z = 2,3, and 4 (from top to bottom, respectively) in the full volumes of TNG300 (solid) and TNG100 (dashed) in black together with the uncertainties computed via jack-knife sampling. The dropoff in TNG300 at the faint end is due to the poorer mass resolution. Various literature measurements at similar redshifts are shown, including Parsa et al. (2016, black symbols), Mehta et al. (2017, red diamonds), Reddy et al. (2008, blue and green diamonds), van der Burg et al. (2010, cyan diamonds), Finkelstein et al. (2015, red right triangles), and Ito et al. (2020, blue right right triangles). In all three panels, blue solid curves show the best-fit Schechter function of Parsa et al. (2016). Right: UVLFs measured within (15 cMpc)3 cubic volumes centered on massive protoclusters are shown as gray lines and shades. The UVLFs for the full volumes of TNG300 and TNG100 are repeated in black. Two red dashed curves in each panel indicate the best-fit Schechter functions for the full and PC15 TNG100 measures. The faint-end slope of the protocluster UVLF is shallower than that of average fields in all cases.
Current usage metrics show cumulative count of Article Views (full-text article views including HTML views, PDF and ePub downloads, according to the available data) and Abstracts Views on Vision4Press platform.
Data correspond to usage on the plateform after 2015. The current usage metrics is available 48-96 hours after online publication and is updated daily on week days.
Initial download of the metrics may take a while.