Fig. 10.
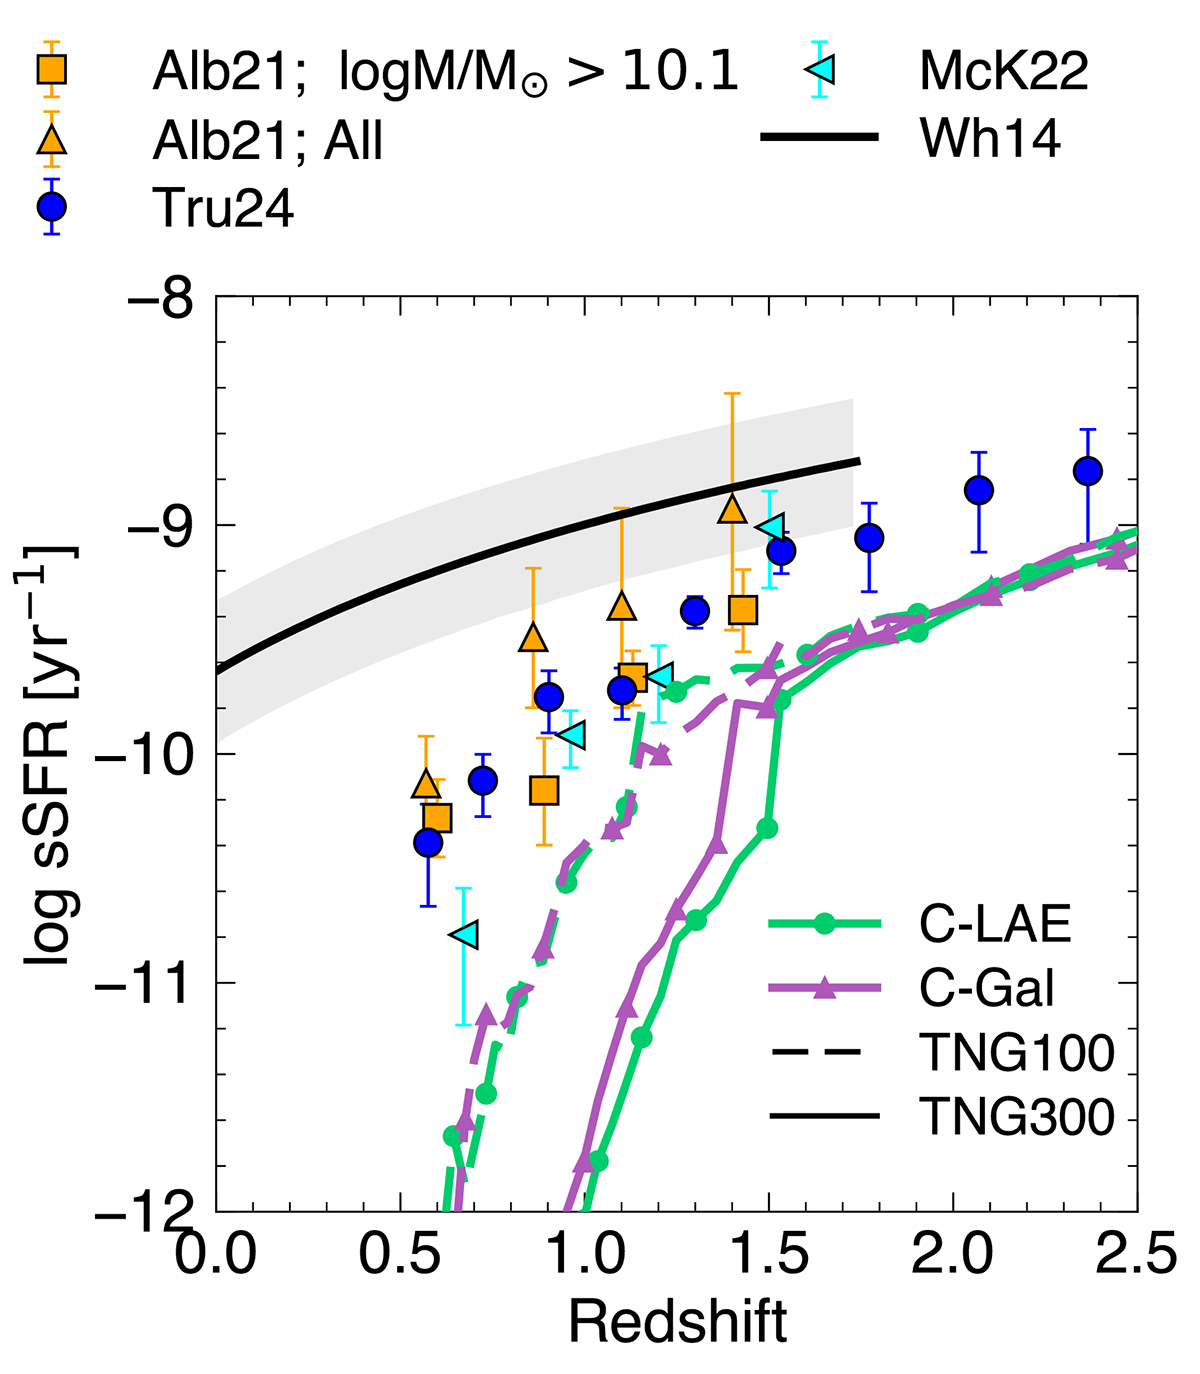
Download original image
Comparison of the sSFR as a function of redshift of the C-LAE (green lines with circles) and C-Gal (purple lines with triangles) samples for TNG300 (solid lines) and TNG100 (dashed lines). We compare our results with observed cluster galaxies from McKinney et al. (2022, cyan left triangles) and from Alberts et al. (2021, orange triangles) using the total light from clusters. Orange squares indicate the measurements for cluster members with log(M★/M⊙)>10.1. We also include data from Trudeau et al. (2024, blue circles) of cluster galaxies. Gray shaded regions denote the star-forming main sequence for field galaxies at a fixed mass of log(M★/M⊙) = 10, from Whitaker et al. (2014).
Current usage metrics show cumulative count of Article Views (full-text article views including HTML views, PDF and ePub downloads, according to the available data) and Abstracts Views on Vision4Press platform.
Data correspond to usage on the plateform after 2015. The current usage metrics is available 48-96 hours after online publication and is updated daily on week days.
Initial download of the metrics may take a while.