Fig. 1.
Download original image
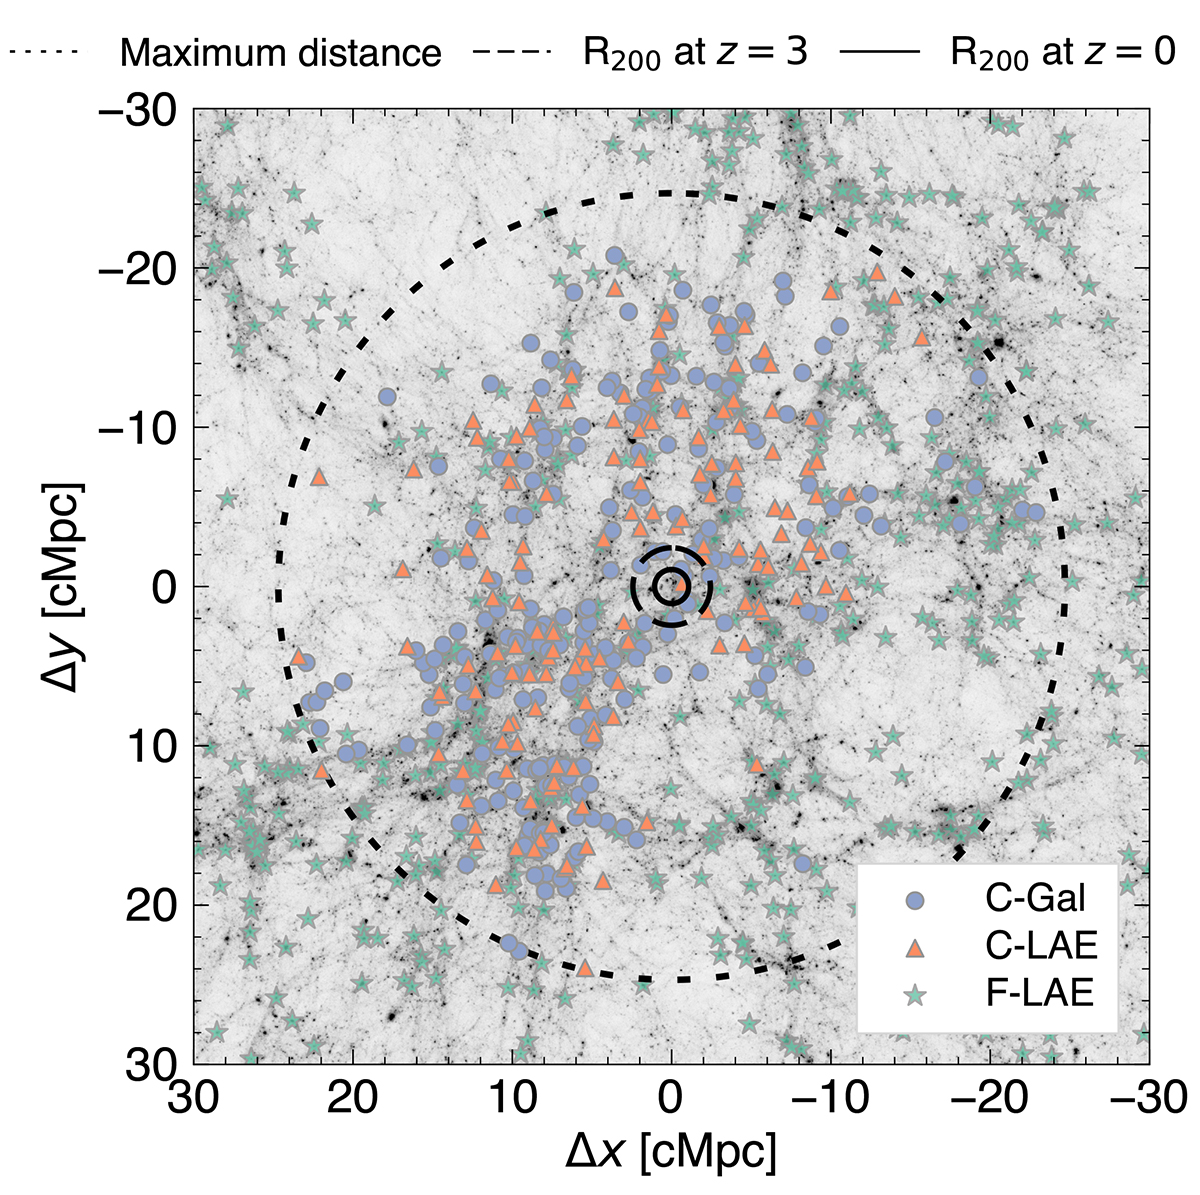
2D map of the galaxies at z = 3 centered in the region of the most massive cluster of TNG300 (selected at z = 0). Blue circles indicate the galaxies belonging to the protocluster (C-Gal). The cluster LAEs (C-LAE) are shown as orange triangles and the field LAEs (F-LAE) are shown as green stars. The outermost black short-dashed circle indicates the distance of the farthest selected galaxy belonging to the protocluster region. The inner lines indicate the M200 radius of the protocluster at z = 3, and z = 0 (long-dashed and solid-lined circles, respectively). The dark matter distribution projected across the thickness of 60 cMpc is shown in the background.
Current usage metrics show cumulative count of Article Views (full-text article views including HTML views, PDF and ePub downloads, according to the available data) and Abstracts Views on Vision4Press platform.
Data correspond to usage on the plateform after 2015. The current usage metrics is available 48-96 hours after online publication and is updated daily on week days.
Initial download of the metrics may take a while.